. 2014 Feb 14;289(7):3960-77.
doi: 10.1074/jbc.M113.526350. Epub 2013 Dec 27.

Spatially restricted G protein-coupled receptor activity via divergent endocytic compartments

Affiliations

Spatially restricted G protein-coupled receptor activity via divergent endocytic compartments

Frederic Jean-Alphonse et al. J Biol Chem. .

Abstract

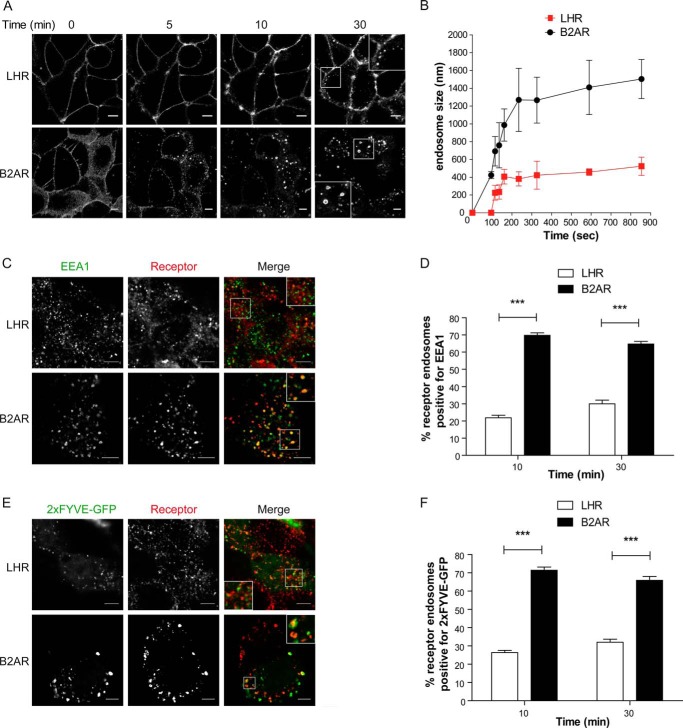
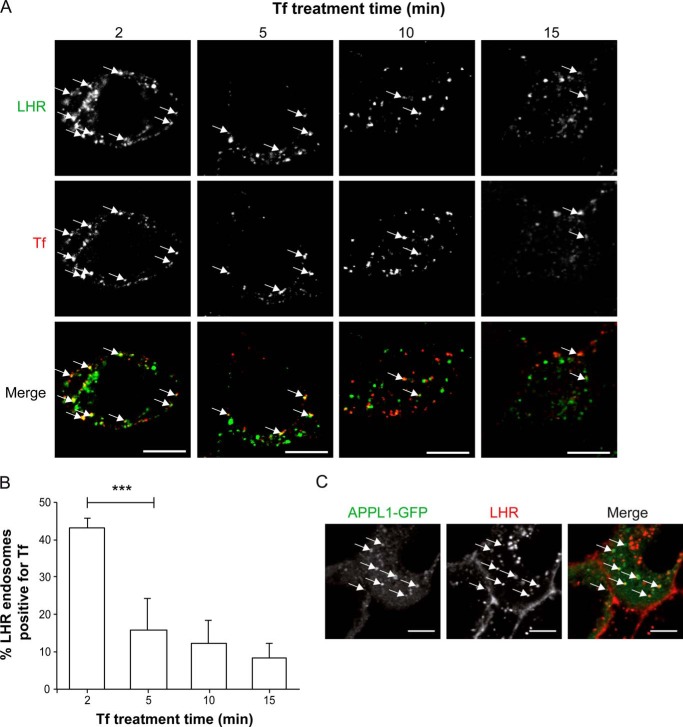
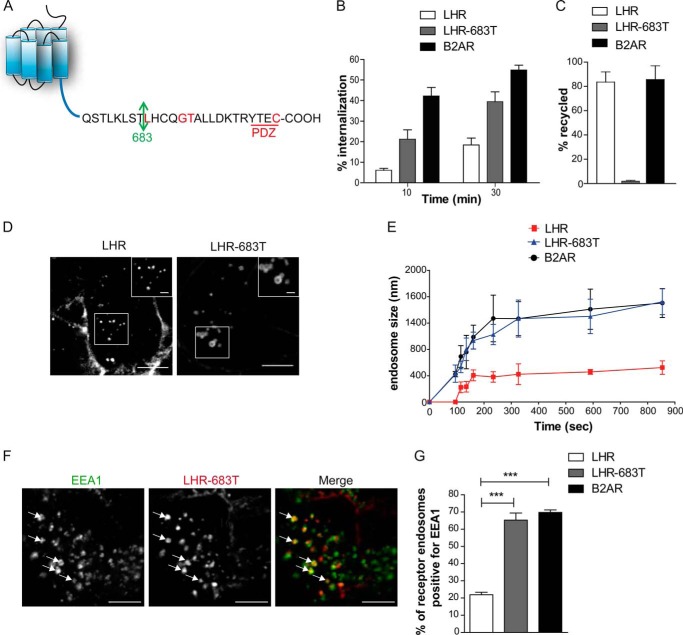
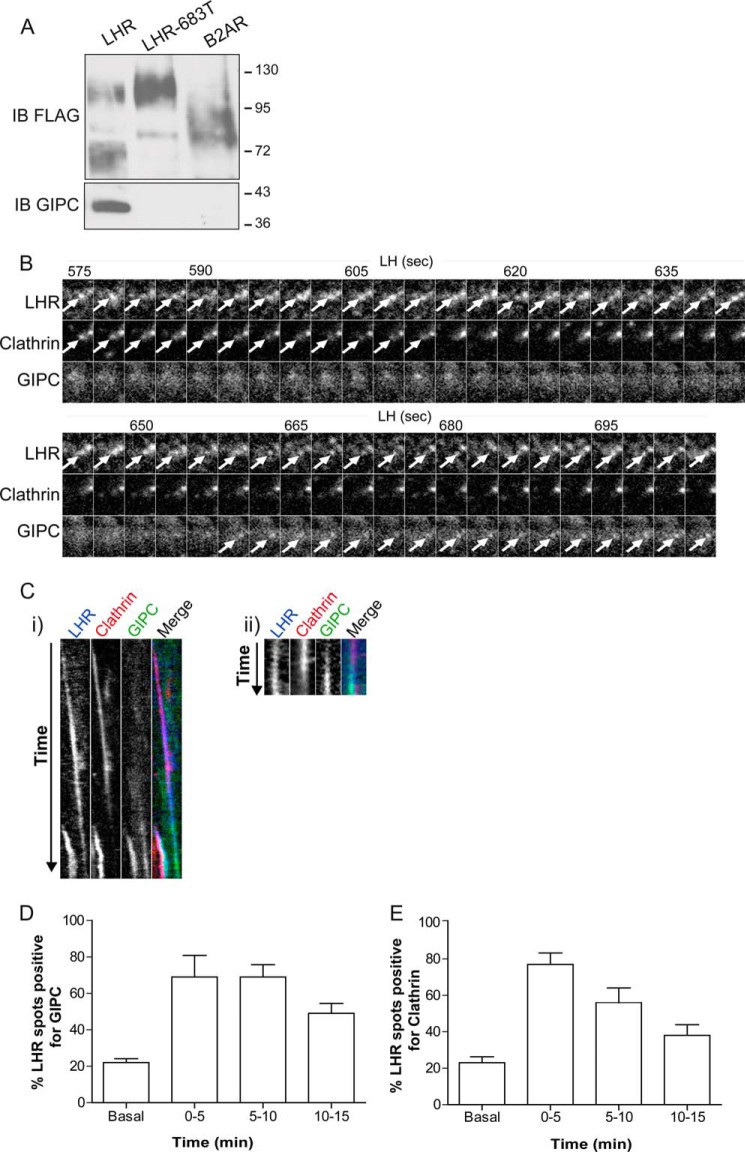
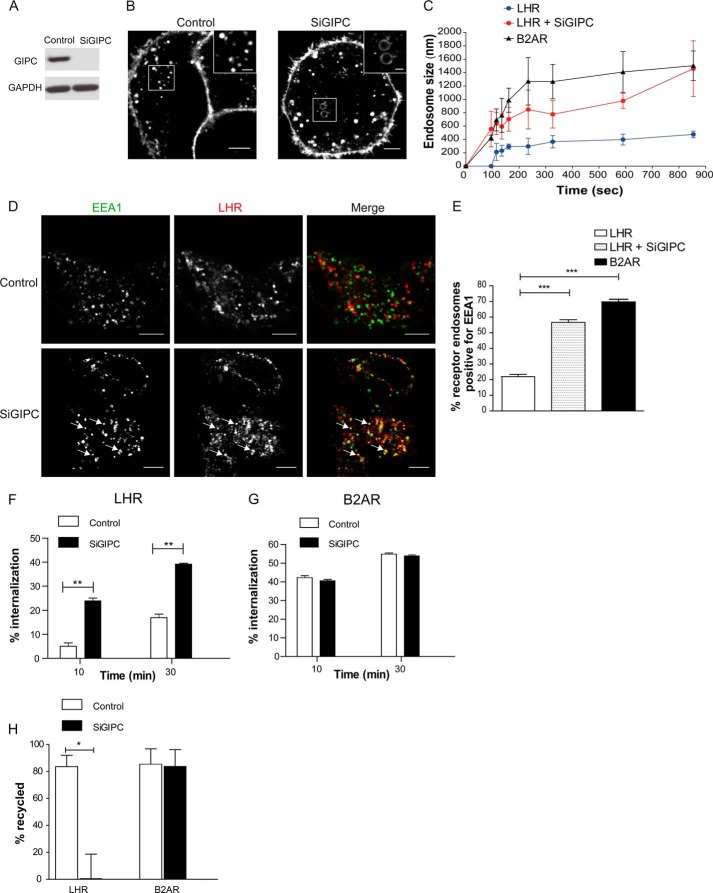
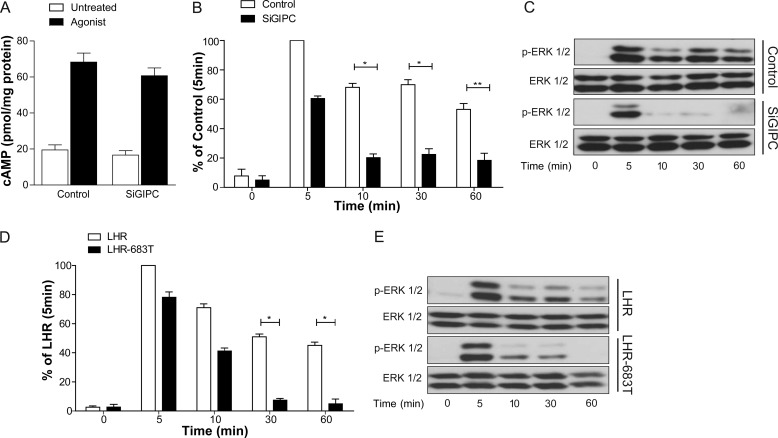
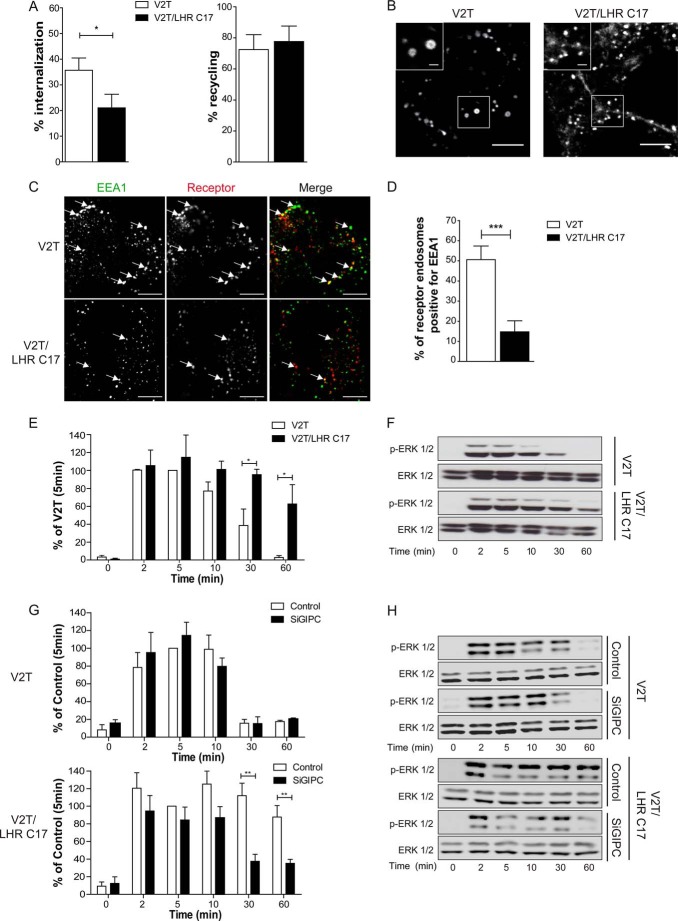
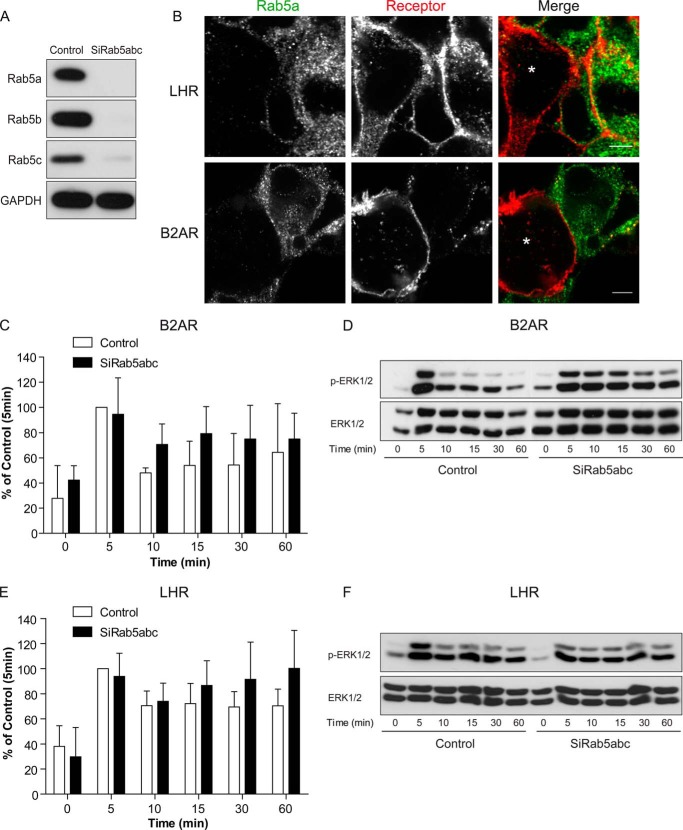
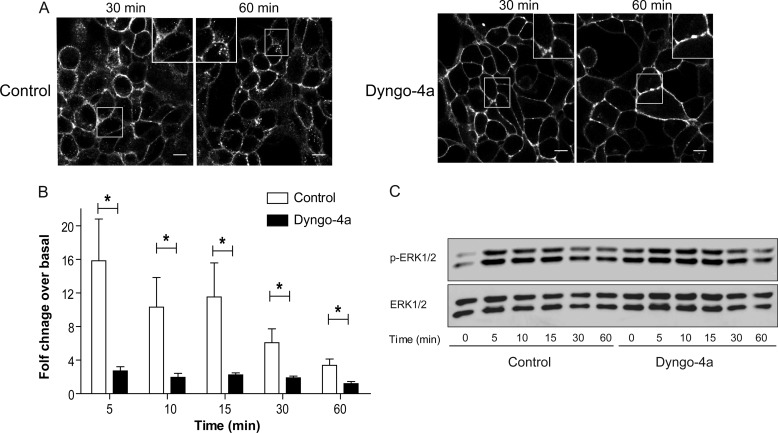
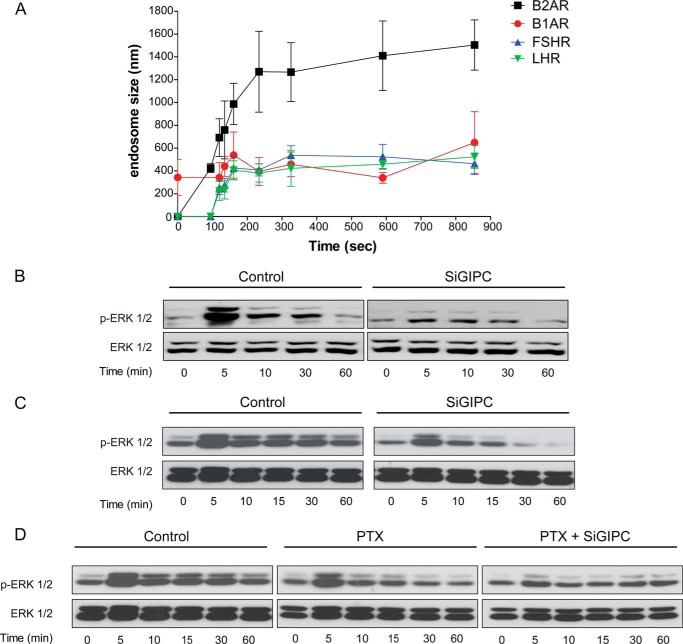
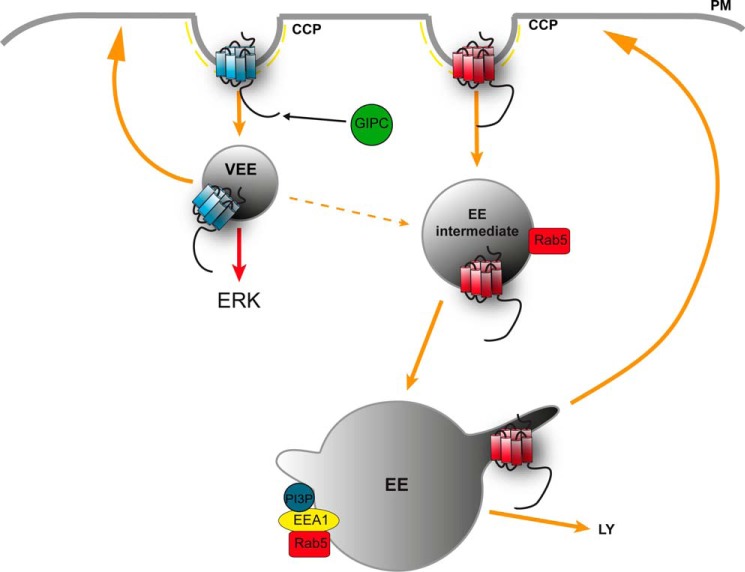
Postendocytic sorting of G protein-coupled receptors (GPCRs) is driven by their interactions between highly diverse receptor sequence motifs with their interacting proteins, such as postsynaptic density protein (PSD95), Drosophila disc large tumor suppressor (Dlg1), zonula occludens-1 protein (zo-1) (PDZ) domain proteins. However, whether these diverse interactions provide an underlying functional specificity, in addition to driving sorting, is unknown. Here we identify GPCRs that recycle via distinct PDZ ligand/PDZ protein pairs that exploit their recycling machinery primarily for targeted endosomal localization and signaling specificity. The luteinizing hormone receptor (LHR) and β2-adrenergic receptor (B2AR), two GPCRs sorted to the regulated recycling pathway, underwent divergent trafficking to distinct endosomal compartments. Unlike B2AR, which traffics to early endosomes (EE), LHR internalizes to distinct pre-early endosomes (pre-EEs) for its recycling. Pre-EE localization required interactions of the LHR C-terminal tail with the PDZ protein GAIP-interacting protein C terminus, inhibiting its traffic to EEs. Rerouting the LHR to EEs, or EE-localized GPCRs to pre-EEs, spatially reprograms MAPK signaling. Furthermore, LHR-mediated activation of MAPK signaling requires internalization and is maintained upon loss of the EE compartment. We propose that combinatorial specificity between GPCR sorting sequences and interacting proteins dictates an unprecedented spatiotemporal control in GPCR signal activity.

Keywords: Endocytosis; Endosomes; G Protein-coupled Receptor (GPCR); GAIP-interacting Protein C Terminus (GIPC); Receptor Recycling; Signaling; Sorting.


Figures

FIGURE 1.
FIGURE 1.
The LHR and B2AR traffic to distinct compartments in the endocytic pathway. A, HEK 293 cells stably expressing FLAG-tagged LHR or B2AR were labeled with fluorescently tagged anti-FLAG antibodies and imaged live with confocal microscopy before and after agonist treatment. The LHR was stimulated with 10 nm LH, and the B2AR was stimulated with 10 μm isoproterenol. The frames shown were taken from a time-lapse series of supplemental Movies S1 and S2. B, the size of the LHR or B2AR containing endosomes was assessed by measuring the diameter of 10 endosomes at each time point stated across three to four movies. Data represent mean ± S.E. C, cells expressing either the LHR or B2AR were fed with anti-FLAG antibody and treated with the agonist for 10 min. Cells were fixed, permeabilized, and stained with an anti-EEA1 antibody and imaged with confocal microscopy. The images shown are representative of 16 cells. D, numbers of LHRs or B2ARs containing endosomes positive for EEA1 following either 10 or 30 min of agonist stimulation were quantified, and the percentage was calculated. Data are mean + S.E.; n = 16 cells, 298 and 295 endosomes respectively for each receptor. E and F, cells were treated as in C and D except that cells were transfected with the PI3P marker 2xFYVE-GFP F, and the number of receptor-containing endosomes positive for 2xFYVE-GFP was quantified (n = 24 and 22 cells, respectively; LHR and B2AR, ∼980 and 500 endosomes, respectively). The arrows represent examples of colocalization. Scale bars = 5 μm. ***, p < 0.001. See also supplemental Movies S1 and S2.
FIGURE 2.
FIGURE 2.
LHR endosomes are upstream of cargo trafficking to the EE and contain APPL1. A, cells stably expressing FLAG-LHR were fed with anti-FLAG antibody and then treated with the agonist LH (10 nm) for 15 min. AF555-labeled Tf was added to LH-stimulated cells for the final 2, 5, or 10 min of LH treatment. For the 15-min Tf treatment, Tf was added simultaneously with LH. Cells were then washed with PBS/0.04% EDTA (see “Experimental Procedures”) and then fixed and permeabilized for treatment with AF488-labeled secondary antibody. Representative confocal microscopy images from three independent experiments are shown. The arrows represent examples of FLAG-LHR and Tf colocalization. Scale bar = 5 μm. B, numbers of FLAG-LHR endosomes positive for Tf following 2, 5, 10, or 15 min of Tf treatment were quantified, and the percentage was calculated. Data are mean + S.E.; n = 8 cells, ∼240 endosomes per condition. ***, p < 0.001. C, cells stably expressing FLAG-LHR were transfected with APPL1-GFP and fed with AF555-labeled FLAG antibody (15min) prior to agonist stimulation (LH, 10 nm). Shown is a representative frame from live imaging of cells via confocal microscopy following 20 min of agonist stimulation. Scale bar = 5 μm.
FIGURE 3.
FIGURE 3.
Targeting of LHR to pre-EEs requires the distal C-terminal tail. A, schematic of the LHR C-terminal tail. Residues highlighted in red have been described to be essential for receptor recycling (29, 40, 41). The arrow indicates the residue mutated to a stop codon to create truncation mutant LHR-683T. B and C, agonist-induced (LH, 10 nm; isoproterenol, 10 μm) internalization (B) and recycling (C) of the LHR, LHR-683T, and B2AR were quantitatively measured by flow cytometry. Data are mean ± S.E., n = 3. D, representative frame from a time-lapse movie of cells stably expressing either LHR or LHR-683T treated with an agonist, indicating the difference in size of endosomes to which each receptor internalizes. Scale bars = 5 μm and 1 μm (insets). E, average diameter of endosomes containing the LHR, LHR-683T, or B2AR following treatment with an agonist across the indicated times. For each time point, 10 endosomes are measured across three to four movies for each receptor. Data are mean ± S.E. F, representative confocal images of fixed cells stably expressing FLAG-LHR-683T following 30 min of agonist treatment and treated with anti-EEA1 antibody. The arrows indicate examples of colocalization of the receptor with EEA1. Scale bars = 5 μm. G, the percentage of receptor positive endosomes with EEA1 was quantified for the LHR, LHR 683T, and B2AR. Data are mean + S.E. (n = 15 cells, 220 endosomes for each receptor). ***, p < 0.001. See also supplemental Movie S3.
FIGURE 4.
FIGURE 4.
The LHR associates with GIPC during agonist-induced internalization. A, interaction of endogenous GIPC with FLAG-tagged receptors by coimmunoprecipitation, followed by immunoblotting (IB) of both FLAG and GIPC. B, total internal reflection fluorescence microscopy images from HeLa cells transiently transfected with FLAG-LHR, clathrin-DsRed, and GIPC-GFP. Representative time-lapse frames were taken every 3 s over a 900-s movie of LH treatment. Images shown are from 575–704 s following LH treatment to indicate LHR recruitment to clathrin followed by the appearance of GIPC when clathrin fluorescence decreases, indicating LHR internalization. The arrows indicate the appearance of LHR, clathrin, or GIPC fluorescence within the same spot. C, i, correspondent kymograph of the whole movie (0–900 s of LH treatment) shown in B. Note the appearance of a second colocalizing LHR/clathrin/GIPC spot, indicating that GIPC can be recruited with the appearance of the LHR in clathrin spots. ii, kymograph of a distinct movie taken every 3 s from 246–309 s following LH treatment, illustrating GIPC recruitment following the appearance of the LHR with clathrin. D and E, the total number of individual LHR spots colocalized with either GIPC (D) or clathrin (E) was counted from maximum projections at the indicated time points of LH stimulation. Data are mean ± S.E. across five independent experiments, representing a total of 209 spots for LHR/GIPC and 194 spots for LHR/clathrin.
FIGURE 5.
FIGURE 5.
Targeting of the LHR to pre-EEs requires GIPC. A, representative Western blot analysis of total cellular levels of GIPC following siRNA-mediated knockdown as indicated. B, representative frames from live cell confocal imaging of LHR agonist-induced internalization following knockdown of GIPC (SiGIPC). Scale bars = 5 μm and 1 μm (insets). C, the size of LHR-containing endosomes was measured as in Fig. 1B in cells treated with either control or SiGIPC. The size of B2AR endosomes is also shown for comparison. Data are mean ± S.E. D, representative confocal images from fixed cells stably expressing FLAG-LHR following GIPC knockdown and stimulated with LH (10 nm) for 30 min, indicating that receptor internalized to endosomes that colocalize with EEA1 (arrows). Scale bars = 5 μm. E, the percentage of LHR-positive endosomes that visually colocalize with EEA1 in cells depleted of GIPC. Data are mean + S.E. (n = 28 cells, 450 endosomes) ***, p < 0.001. F and G, LHR and B2AR ligand-induced internalization and recycling following GIPC siRNA-mediated knockdown was analyzed by flow cytometry. Cells were treated with anti-FLAG antibodies to label the surface receptors prior to treatment with agonist (10 or 30 min with either LH (10 nm) or isoproterenol (10 μm)) to internalize the receptors. Cells treated for 30 min with the agonist were washed and incubated in medium for 1 h to allow for receptor recycling. The percentage of internalization refers to the fractional reduction of the surface receptor in response to agonist exposure for the LHR (F) and B2AR (G) **, p < 0.01. H, the percentage of receptor recycled refers to the fractional recovery of the surface receptor following agonist washout for 1 h. Data represent the mean ± S.E. from three independent experiments. *, p < 0.05.
FIGURE 6.
FIGURE 6.
Trafficking to pre-EEs is essential for a sustained LHR-mediated MAPK signaling profile. A, intracellular levels of cAMP were measured in cells stably expressing the LHR following treatment with either control siRNA (Control) or GIPC siRNA (SiGIPC). Cells were stimulated with LH (10 nm) for 90 s. B and C, HEK 293 cells stably expressing LHR were treated with either control or GIPC siRNA, and phosphorylation of ERK 1/2 was determined by Western blotting. Total ERK was used as a loading control. For B, densitometric analysis of ERK 1/2 phosphorylation was normalized to the 5-min control stimulation. A representative immunoblot is shown in C. Data represent mean ± S.E. (n = 5). D and E, HEK 293 cells stably expressing either FLAG-LHR or FLAG-LHR-683T were treated with an agonist for the indicated times, and phosphorylation of ERK 1/2 was determined by Western blotting. For D, densitometric analysis of ERK 1/2 phosphorylation was normalized to the 5-min LHR stimulation. A representative immunoblot is shown in E. Data represent mean ± S.E. (n = 3). *, p < 0.05; **, p < 0.01.
FIGURE 7.
FIGURE 7.
The distal C-terminal tail of the LHR is sufficient to reroute EE-localized receptors to pre-EEs and a sustained MAPK signaling profile. A, ligand-induced internalization and recycling of HEK 293 cells stably expressing FLAG-V2T or FLAG-V2T/LHR C17 was quantitatively measured via flow cytometry. Cells were treated with anti-FLAG antibodies to label the surface receptors prior to treatment with an agonist (30 min, arginine-vasopressin, 1 μm) to internalize the receptors. Cells were then washed and incubated in medium for 1 h to allow for receptor recycling. Surface receptor immunoreactivity was determined by flow cytometry. The percentage of internalization refers to the fractional reduction of the surface receptor in response to agonist exposure. The percentage of receptor recycled refers to the fractional recovery of the surface receptor following agonist washout for 1 h. Data represent mean ± S.E. from three independent experiments. *, p < 0.05. B, representative frames from live cell confocal imaging of cells expressing FLAG-V2T or FLAG-V2T/LHR C17 following agonist-induced internalization. Scale bars = 5 μm and 1 μm (insets). C, representative confocal images of fixed cells stably expressing FLAG-V2T or FLAG-V2T/LHR C17 following 30 min of agonist treatment (arginine-vasopressin, 1 μm) and treated with anti-EEA1 antibody. The arrows indicate examples of colocalization of the receptor with EEA1 Scale bars = 5 μm. D, the percentage of receptor-positive endosomes with EEA1 was quantified for V2R and V2T/LHR C17. Data are mean + S.E. (n = 10 cells, ∼280 endosomes for V2T, and 240 endosomes for V2T/LHR C17). ***, p < 0.001. E and F, HEK 293 cells stably expressing either FLAG-V2T or FLAG-V2T/LHR C17 were treated with arginine-vasopressin (1 μm) for the indicated time points. E, densitometric analysis of ERK 1/2 phosphorylation was normalized to the 5 min stimulation of V2T-expressing cells. Data represent mean ± S.E. (n = 3). *, p < 0.05. G and H, HEK 293 cells stably expressing either V2T or V2T/LHR C17 were treated with either control or GIPC siRNA (SiGIPC), and phosphorylation of ERK 1/2 was determined by Western blotting. Total ERK was used as a loading control. Representative immunoblots are shown in H. For G, densitometric analysis of ERK 1/2 phosphorylation was normalized to the 5-min control stimulation. Data represent mean ± S.E. (n = 4).
FIGURE 8.
FIGURE 8.
LH-induced sustained ERK signaling is independent of Rab5. A, representative Western blot analysis of total cellular levels of Rab5a, b, and c following siRNA-mediated knockdown of Rab5 a, b, and c. B, confocal images of cells expressing FLAG-B2AR or FLAG-LHR, treated with either control or Rab5 a/b/c siRNAs, were cocultured to directly compare Rab5-positive and -negative cells with receptor internalization within the same imaging field. Cells were fed with anti-FLAG antibody (red) and stimulated with ligand (10 nm LH or 10 μm isoproterenol) for 10 min for the B2AR or 30 min for the LHR before fixation, permeabilization, and treatment with anti-Rab5a antibodies (green). Cells effectively depleted for Rab5 are indicated by an asterisk. Scale bars, 5 μm. C and D, measurement of B2AR-mediated ERK 1/2 phosphorylation following Rab5 depletion. Cells were stimulated with isoproterenol (10 μm) for the indicated time points before lysis and immunoblotting. C, densitometric analysis of immunoblot analysis from three independent experiments. Data are normalized to 5-min stimulation of control siRNA-treated cells and represent mean + S.E. (n = 3). In D, a representative immunoblot analysis is shown with total ERK as a loading control. E and F, measurement of LHR-mediated ERK 1/2 phosphorylation following Rab5 depletion. Cells were stimulated with LH (10 nm) for the indicated time points before lysis and immunoblotting. E, densitometric analysis of immunoblot analyses from three independent experiments. Data are normalized to 5-min stimulation of control siRNA-treated cells and represent mean + S.E. (n = 3). In F, a representative immunoblot analysis is shown with total ERK as a loading control.
FIGURE 9.
FIGURE 9.
Agonist-induced activation of ERK signaling by the LHR requires internalization. A, agonist-induced internalization of the LHR was inhibited by pretreatment of cells with Dyngo-4a (30 μm) 15 min prior to LH stimulation (10 nm). Shown are representative frames from live confocal imaging of LHR-expressing cells following 30 or 60 min of agonist stimulation. Scale bars, 5 μm. B and C, LHR internalization was inhibited by pretreatment of cells with Dyngo-4a (30 μm) 15 min prior to LH stimulation (10 nm) for the times indicated, and ERK 1/2 phosphorylation was measured. In B, densitometric analysis of immunoblot analyses is expressed as agonist-induced fold change over basal and represents mean + S.E. (n = 5). *, p < 0.05. C, representative immunoblot analysis of LHR-mediated pERK 1/2 activation following LH (10 nm) stimulation for the indicated times. Total ERK 1/2 was used as a loading control.
FIGURE 10.
FIGURE 10.
Distinct GPCRs localized to small endosomes also require GIPC for a sustained MAPK signaling profile. A, the size of FSHR- and B1AR-containing endosomes following agonist-induced internalization. Cells were treated with either FSH (10 nm) or isoproterenol (10 μm) following treatment with fluorescently labeled FLAG (FSHR) or HA (B1AR) antibodies. Endosome size was assessed by measuring the diameter of 10 endosomes at each time point stated across three movies. Data represent mean ± S.E. The data from Fig. 1B of LHR and B2AR endosome diameters are shown for comparison. B and C, representative immunoblot analyses of ligand-induced FSHR (B) and B1AR (C) ERK 1/2 phosphorylation treated with either control or GIPC siRNA (SiGIPC). Cells were treated with either FSH (10 nm) or isoproterenol (10 μm) for the indicated time points. D, cells expressing B1AR were pre-treated with pertussis toxin (PTX) (200 ng/ml, 18 h) with or without cotreatment of GIPC siRNA. Cells were then treated with isoproterenol (10 μm) for the indicated time points. Phosphorylation of ERK 1/2 was determined by Western blotting, and total ERK 1/2 was used as a loading control. A representative immunoblot analysis is shown.
FIGURE 11.
FIGURE 11.
Model depicting spatial restriction of GPCR signaling via divergent endocytic compartments. Internalization of activated plasma membrane GPCRs via CCPs is targeted to pre-EEs or VEEs via recruitment and binding of the PDZ protein GIPC at the CCP. The VEE sorts receptors to the regulated plasma membrane recycling pathway, and targeting of GPCRs to this compartment generates a sustained MAPK signaling response. Receptors that do not bind GIPC are trafficked to the classic EE for subsequent sorting to the recycling pathway (regulated or default) or to the lysosome for degradation. The model depicts that VEEs and EEs may be interconnected compartments (dotted arrow), possibly via Rab5 endocytic intermediates.

Similar articles

Cited by

References

    1. Shenoy S. K., Lefkowitz R. J. (2011) β-Arrestin-mediated receptor trafficking and signal transduction. Trends Pharmacol. Sci. 32, 521–533 - PMC - PubMed
    1. Smith N. J., Milligan G. (2010) Allostery at G protein-coupled receptor homo- and heteromers. Uncharted pharmacological landscapes. Pharmacol. Rev. 62, 701–725 - PMC - PubMed
    1. Stallaert W., Christopoulos A., Bouvier M. (2011) Ligand functional selectivity and quantitative pharmacology at G protein-coupled receptors. Expert Opin. Drug. Discov. 6, 811–825 - PubMed
    1. Durieux A. C., Prudhon B., Guicheney P., Bitoun M. (2010) Dynamin 2 and human diseases. J. Mol. Med. 88, 339–350 - PubMed
    1. Jovic M., Sharma M., Rahajeng J., Caplan S. (2010) The early endosome. A busy sorting station for proteins at the crossroads. Histol. Histopathol. 25, 99–112 - PMC - PubMed

Publication types

MeSH terms

Substances