

Multispectral near-IR reflectance imaging of simulated early occlusal lesions: variation of lesion contrast with lesion depth and severity
- PMID: 24375543
- PMCID: PMC3961544
- DOI: 10.1002/lsm.22216
Multispectral near-IR reflectance imaging of simulated early occlusal lesions: variation of lesion contrast with lesion depth and severity
Abstract
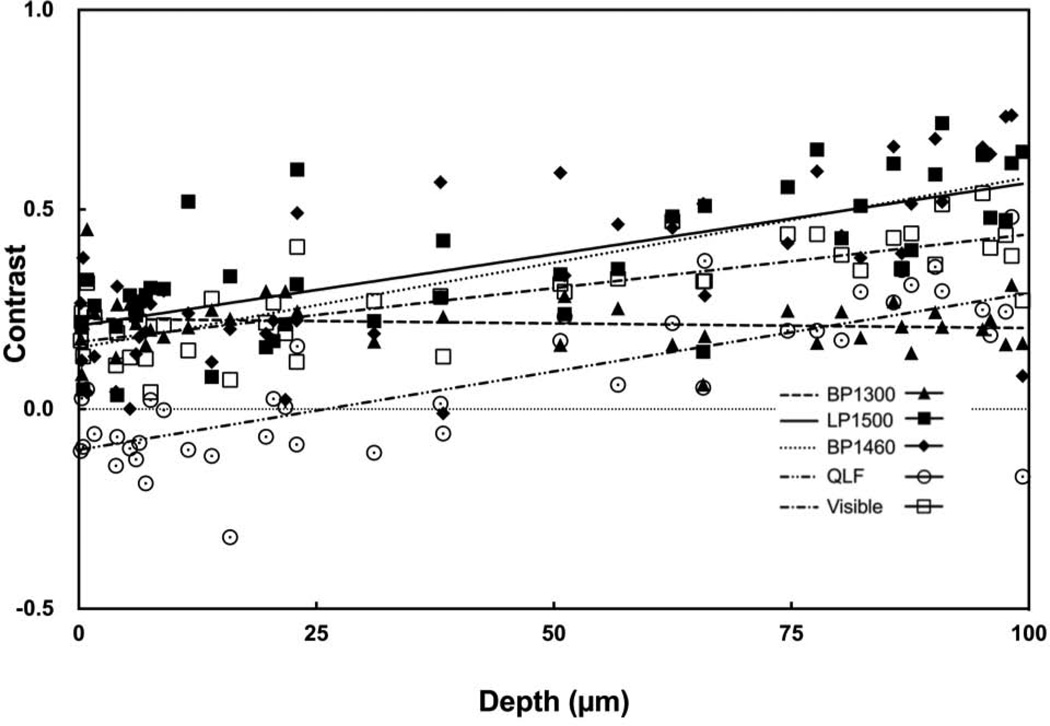
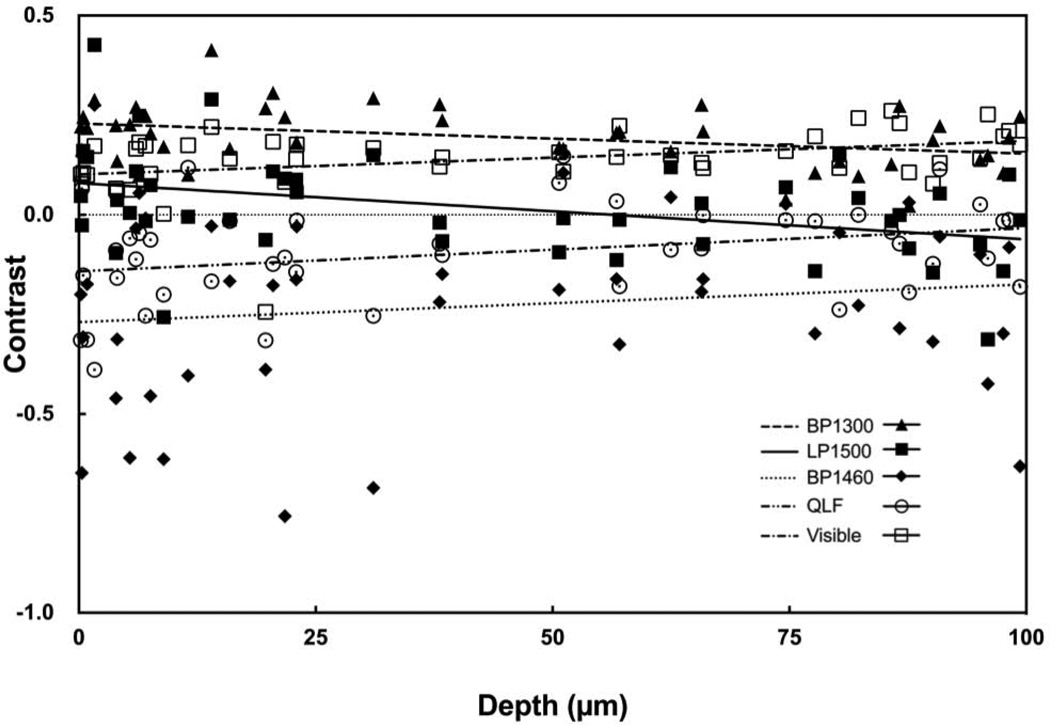
Background and objectives: Early demineralization appears with high contrast at near-IR wavelengths due to a 10- to 20-fold difference in the magnitude of light scattering between sound and demineralized enamel. Water absorption in the near-IR has a significant effect on the lesion contrast and the highest contrast has been measured in spectral regions with higher water absorption. The purpose of this study was to determine how the lesion contrast changes with lesion severity and depth for different spectral regions in the near-IR and compare that range of contrast with visible reflectance and fluorescence.
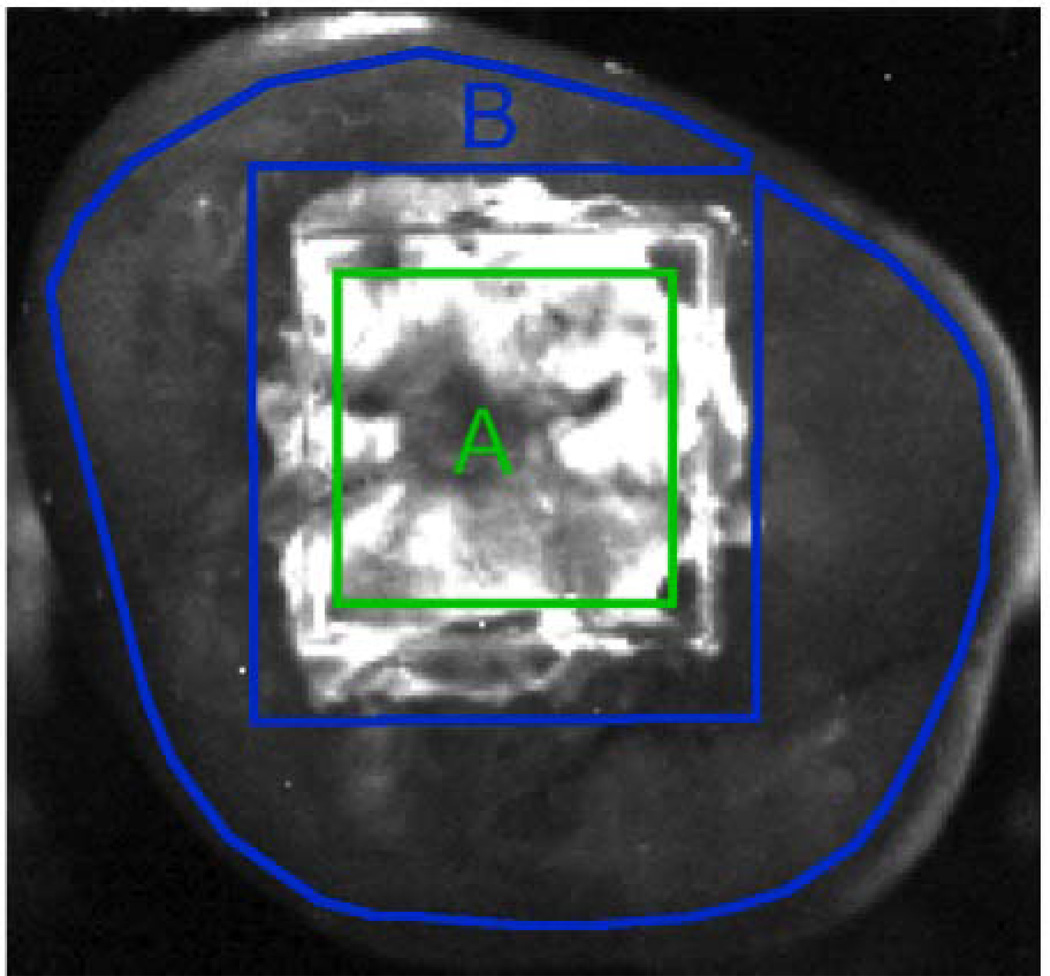
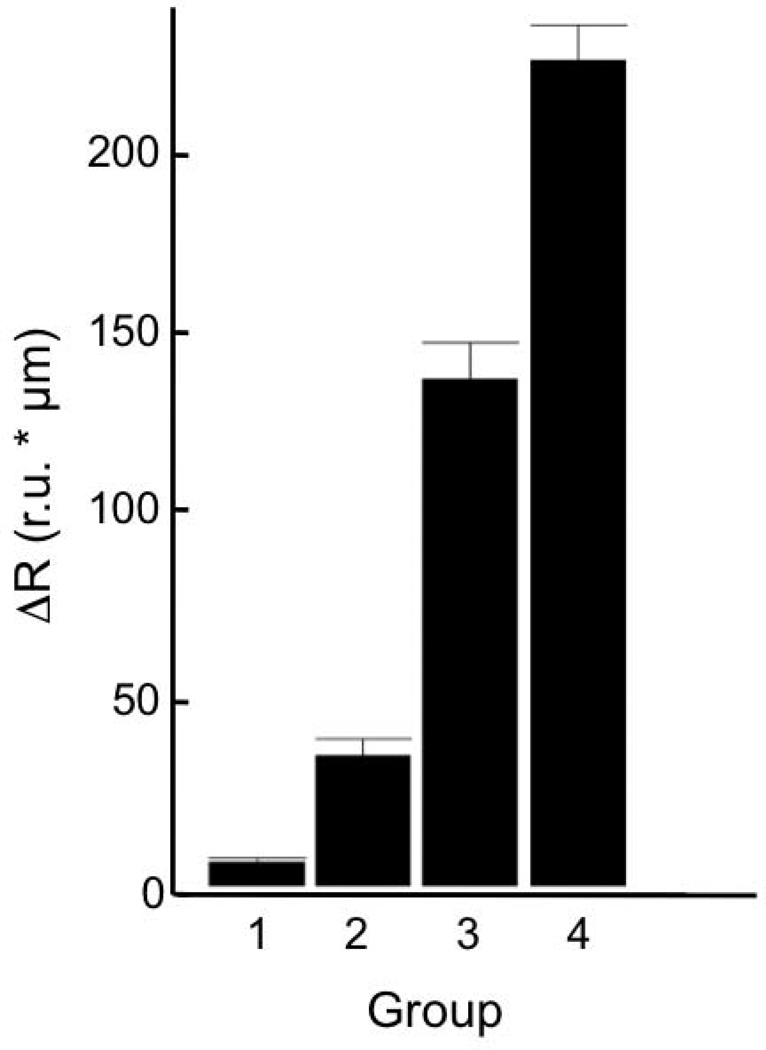
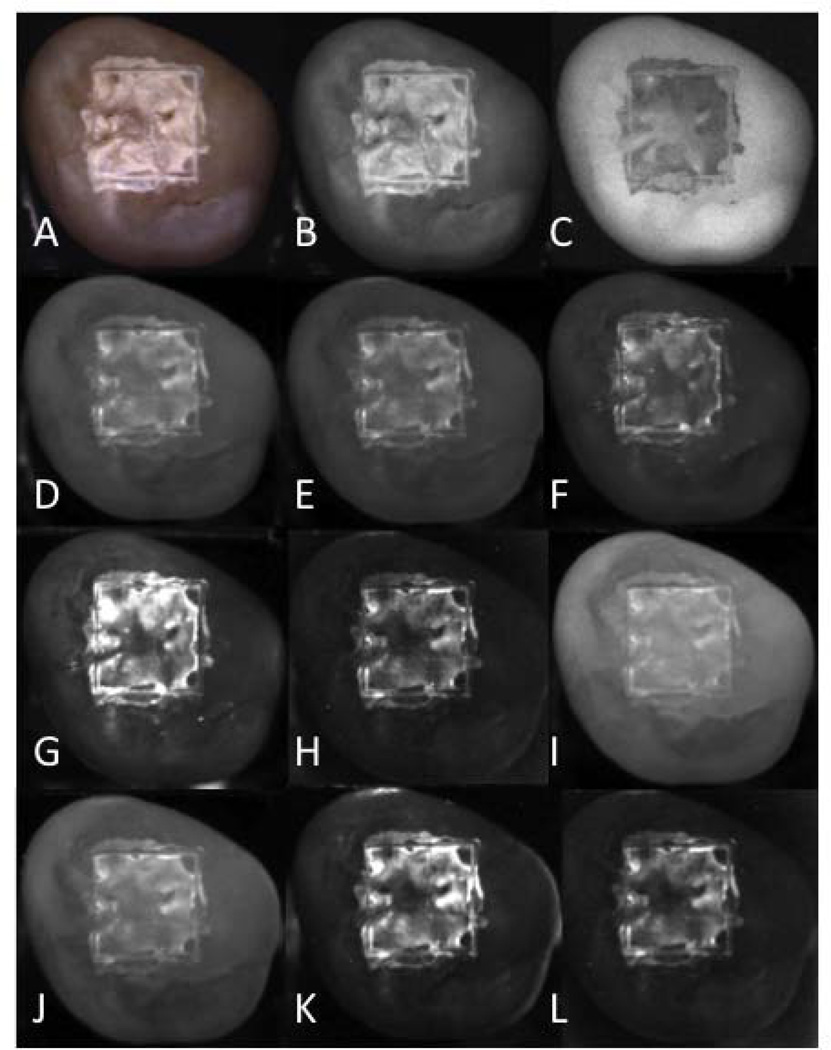
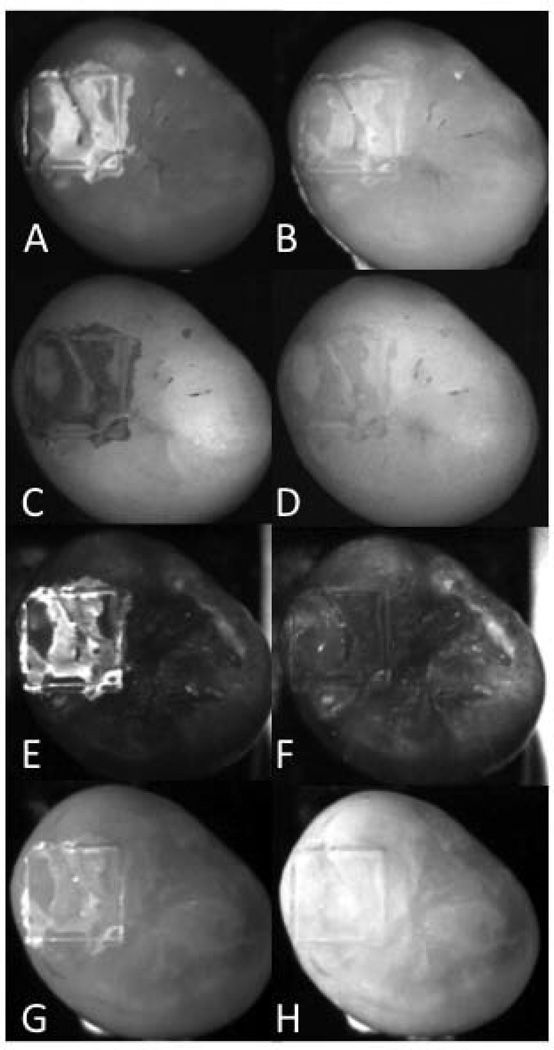
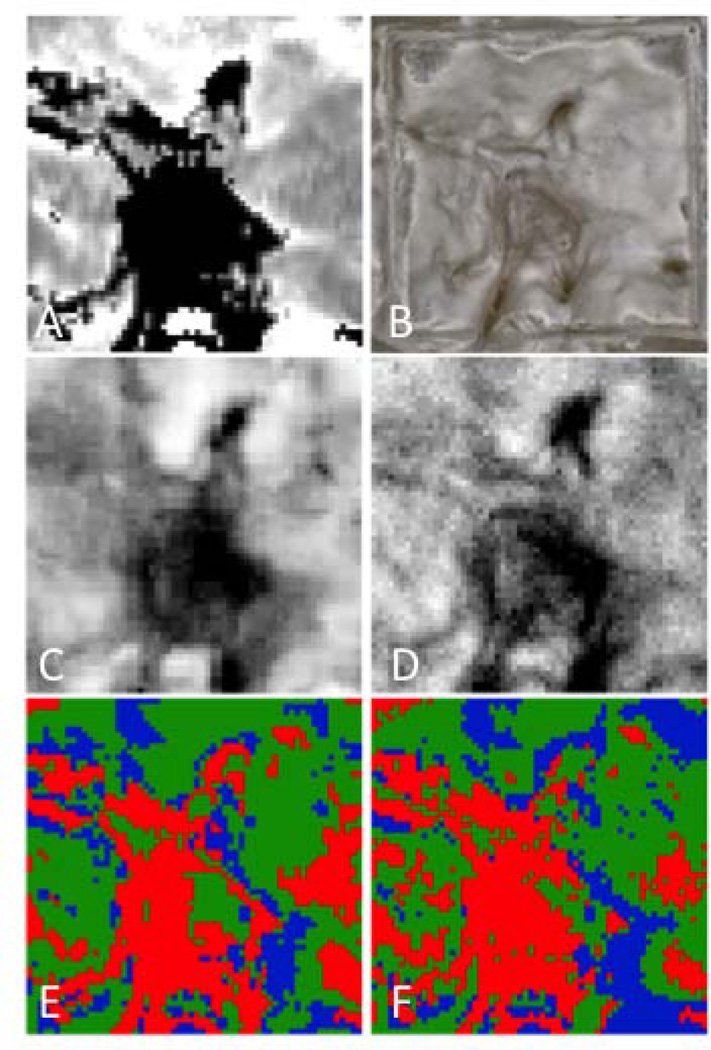
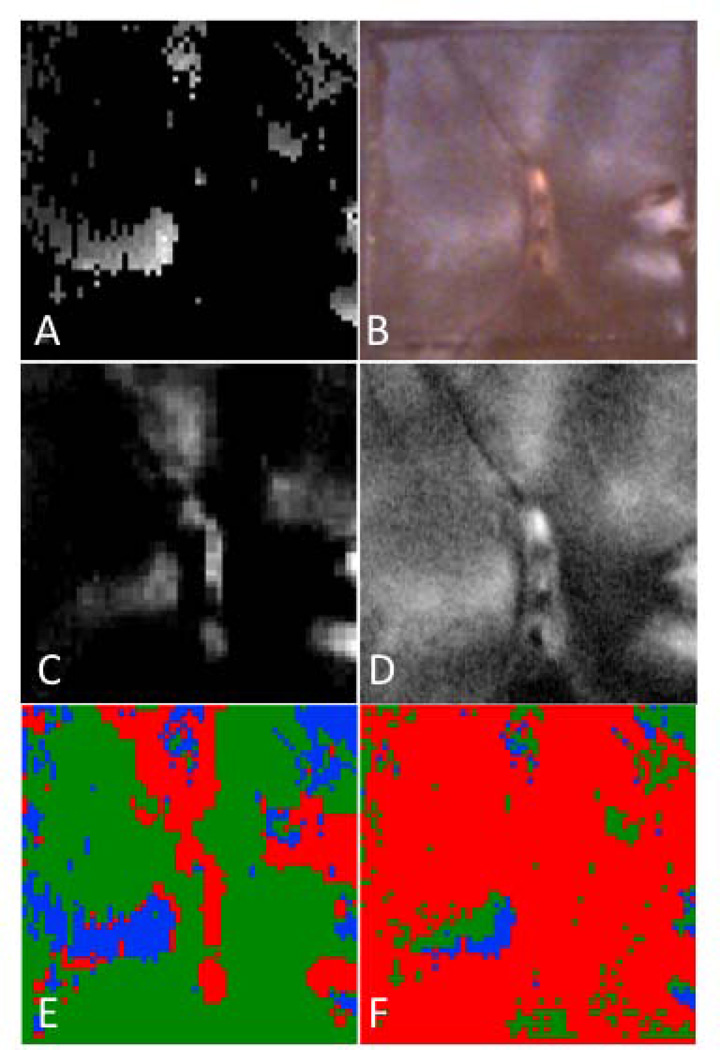
Materials and methods: Forty-four human molars were used in this in vitro study. Teeth were painted with an acid-resistant varnish, leaving a 4 mm × 4 mm window on the occlusal surface of each tooth exposed for demineralization. Artificial lesions were produced in the unprotected windows after 12-48 hours exposure to a demineralizing solution at pH 4.5. Near-IR reflectance images were acquired over several near-IR spectral distributions, visible light reflectance, and fluorescence with 405-nm excitation and detection at wavelengths >500-nm. Crossed polarizers were used for reflectance measurements to reduce interference from specular reflectance. Cross polarization optical coherence tomography (CP-OCT) was used to non-destructively assess the depth and severity of demineralization in each sample window. Matching two-dimensional CP-OCT images of the lesion depth and integrated reflectivity were compared with the reflectance and fluorescence images to determine how accurately the variation in the lesion contrast represents the variation in the lesion severity.
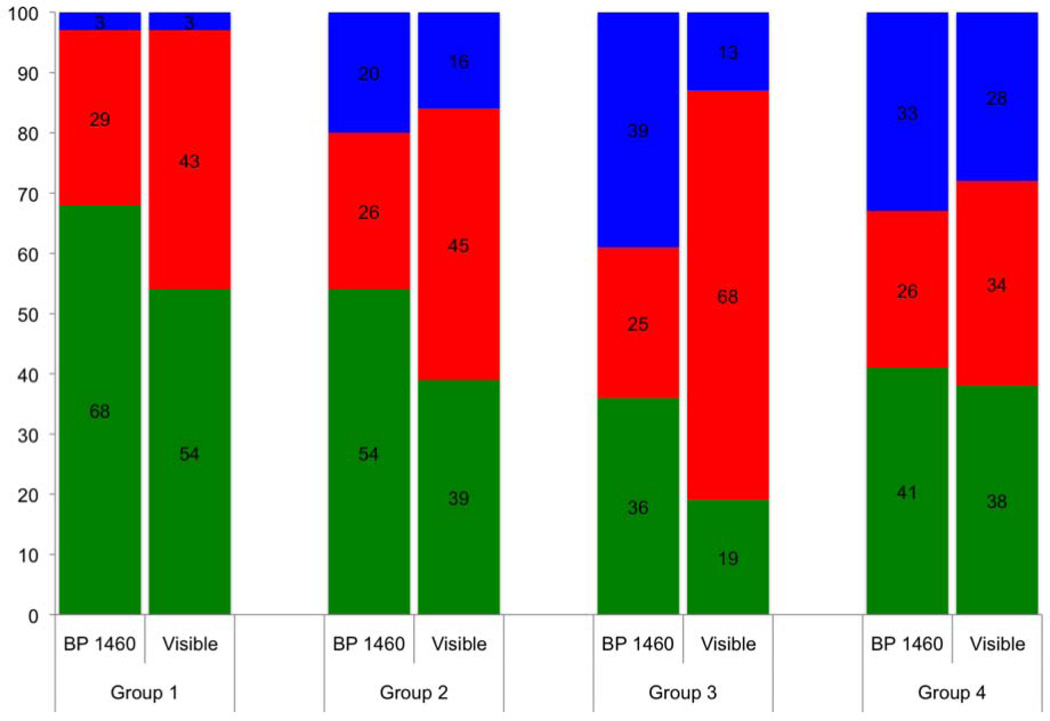
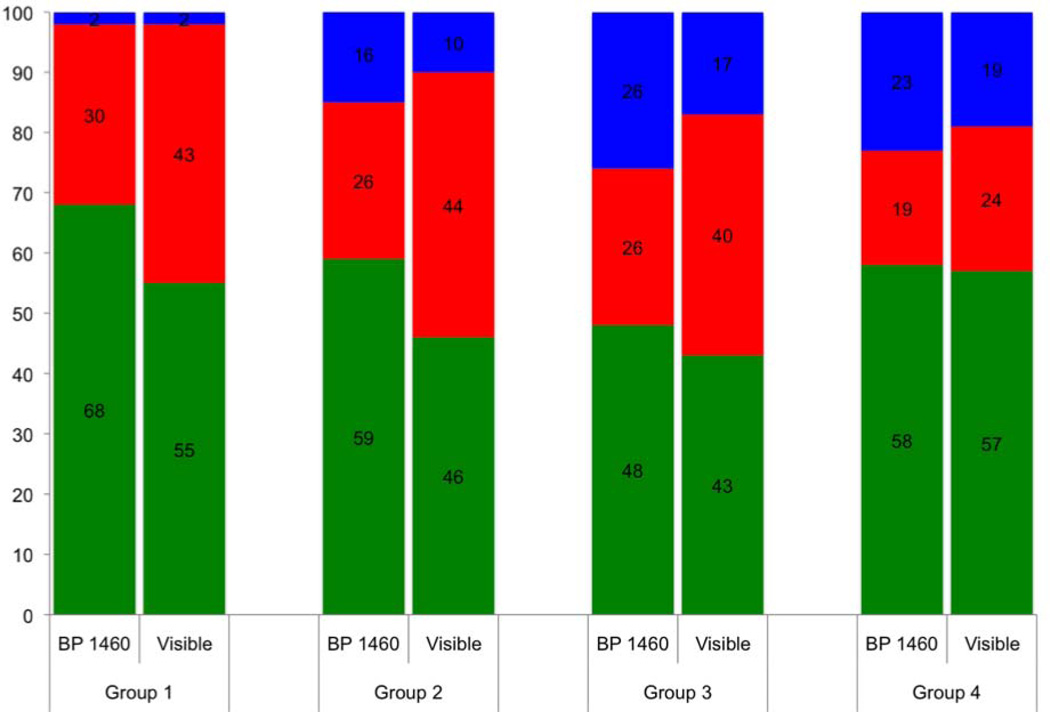
Results: Artificial lesions appear more uniform on tooth surfaces exposed to an acid challenge at visible wavelengths than they do in the near-IR. Measurements of the lesion depth and severity using CP-OCT show that the lesion severity varies markedly across the sample windows and that the lesion contrast in the visible does not accurately reflect the large variation in the lesion severity. Reflectance measurements at certain near-IR wavelengths more accurately reflect variation in the depth and severity of the lesions.
Conclusion: The results of the study suggest that near-IR reflectance measurements at longer wavelengths coincident with higher water absorption are better suited for imaging early caries lesions.
Keywords: demineralization; dental caries; enamel; near-IR imaging; polarization.
© 2013 Wiley Periodicals, Inc.
Figures
Similar articles
-
High contrast reflectance imaging of simulated lesions on tooth occlusal surfaces at near-IR wavelengths.Lasers Surg Med. 2013 Oct;45(8):533-41. doi: 10.1002/lsm.22159. Epub 2013 Jul 16. Lasers Surg Med. 2013. PMID: 23857066 Free PMC article.
-
High contrast near-infrared polarized reflectance images of demineralization on tooth buccal and occlusal surfaces at lambda = 1310-nm.Lasers Surg Med. 2009 Mar;41(3):208-13. doi: 10.1002/lsm.20746. Lasers Surg Med. 2009. PMID: 19291753 Free PMC article.
-
Imaging Early Demineralization on Tooth Occlusal Surfaces with a High Definition InGaAs Camera.Proc SPIE Int Soc Opt Eng. 2013 Mar 25;8566:85660I-. doi: 10.1117/12.2011015. Proc SPIE Int Soc Opt Eng. 2013. PMID: 24357911 Free PMC article.
-
Near-IR and CP-OCT imaging of suspected occlusal caries lesions.Lasers Surg Med. 2017 Mar;49(3):215-224. doi: 10.1002/lsm.22641. Epub 2017 Mar 24. Lasers Surg Med. 2017. PMID: 28339115 Free PMC article.
-
Multispectral cross-polarization reflectance measurements suggest high contrast of demineralization on tooth surfaces at wavelengths beyond 1300 nm due to reduced light scattering in sound enamel.J Biomed Opt. 2018 Jun;23(6):1-4. doi: 10.1117/1.JBO.23.6.060501. J Biomed Opt. 2018. PMID: 29877068 Free PMC article.
Cited by
-
Assessment of the activity of secondary caries lesions with short-wavelength infrared, thermal, and optical coherence tomographic imaging.J Biomed Opt. 2023 Sep;28(9):094801. doi: 10.1117/1.JBO.28.9.094801. Epub 2023 Jan 10. J Biomed Opt. 2023. PMID: 36761935 Free PMC article.
-
Time-resolved SWIR imaging for the assessment of the activity of occlusal caries lesions.J Biophotonics. 2023 Oct;16(10):e202300165. doi: 10.1002/jbio.202300165. Epub 2023 Jun 22. J Biophotonics. 2023. PMID: 37316468 Free PMC article.
-
High Contrast Reflectance Imaging of Enamel Demineralization and Remineralization at 1950-nm for the Assessment of Lesion Activity.Lasers Surg Med. 2021 Sep;53(7):968-977. doi: 10.1002/lsm.23371. Epub 2021 Jan 13. Lasers Surg Med. 2021. PMID: 33442896 Free PMC article.
-
Selective removal of demineralized enamel using a CO2 laser coupled with near-IR reflectance imaging.Proc SPIE Int Soc Opt Eng. 2015 Feb 24;9306:93060M. doi: 10.1117/12.2083647. Proc SPIE Int Soc Opt Eng. 2015. PMID: 25914497 Free PMC article.
-
Imaging dental fluorosis at SWIR wavelengths from 1300 to 2000-nm.Proc SPIE Int Soc Opt Eng. 2021 Mar;11627:116270Q. doi: 10.1117/12.2588696. Epub 2021 Mar 5. Proc SPIE Int Soc Opt Eng. 2021. PMID: 33767522 Free PMC article.
References
-
- Fried D, Featherstone JDB, Glena RE, Seka W. The nature of light scattering in dental enamel and dentin at visible and near-IR wavelengths. Appl Optics. 1995;34(7):1278–1285. - PubMed
-
- Jones RS, Fried D. Lasers in Dentistry VIII. Vol. 4610. San Jose: SPIE; 2002. Attenuation of 1310-nm and 1550-nm Laser Light through Sound Dental Enamel; pp. 187–190.
-
- Darling CL, Huynh GD, Fried D. Light Scattering Properties of Natural and Artificially Demineralized Dental Enamel at 1310-nm. J Biomed Optics. 2006;11(3):034023. - PubMed
Publication types
MeSH terms
Grants and funding
LinkOut - more resources
Full Text Sources
Other Literature Sources
Miscellaneous
