

Modelling and rescuing neurodevelopmental defect of Down syndrome using induced pluripotent stem cells from monozygotic twins discordant for trisomy 21
- PMID: 24375627
- PMCID: PMC3927959
- DOI: 10.1002/emmm.201302848
Modelling and rescuing neurodevelopmental defect of Down syndrome using induced pluripotent stem cells from monozygotic twins discordant for trisomy 21
Abstract
Down syndrome (trisomy 21) is the most common viable chromosomal disorder with intellectual impairment and several other developmental abnormalities. Here, we report the generation and characterization of induced pluripotent stem cells (iPSCs) derived from monozygotic twins discordant for trisomy 21 in order to eliminate the effects of the variability of genomic background. The alterations observed by genetic analysis at the iPSC level and at first approximation in early development illustrate the developmental disease transcriptional signature of Down syndrome. Moreover, we observed an abnormal neural differentiation of Down syndrome iPSCs in vivo when formed teratoma in NOD-SCID mice, and in vitro when differentiated into neuroprogenitors and neurons. These defects were associated with changes in the architecture and density of neurons, astroglial and oligodendroglial cells together with misexpression of genes involved in neurogenesis, lineage specification and differentiation. Furthermore, we provide novel evidence that dual-specificity tyrosine-(Y)-phosphorylation regulated kinase 1A (DYRK1A) on chromosome 21 likely contributes to these defects. Importantly, we found that targeting DYRK1A pharmacologically or by shRNA results in a considerable correction of these defects.
Figures
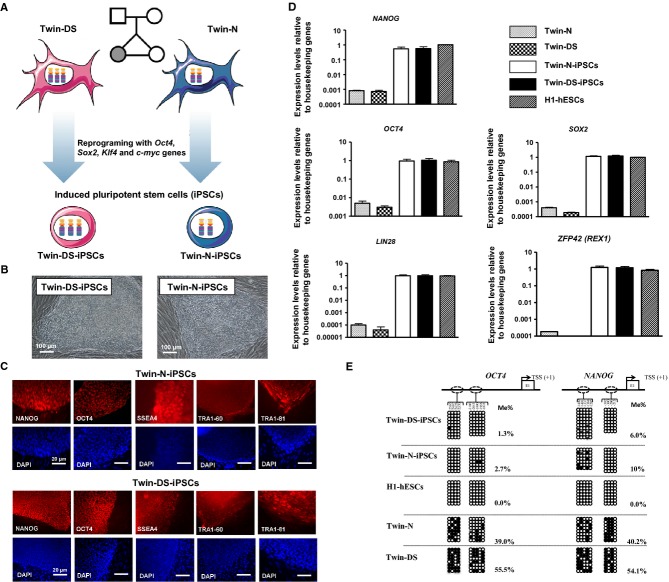
Schematic representation of Twin-N and Twin-DS parental fibroblasts reprogramming into Twin-N-iPSCs and Twin-DS-iPSCs using OCT4, SOX2, KLF4 and c-MYC genes
Phase contrast images of Twin-N-iPSCs and Twin-DS-iPSCs growing on feeder cells.
Immunofluorescence staining of Twin-N-iPSC and Twin-DS-iPSC lines for pluripotency markers NANOG, OCT4, SSEA4, TRA1-60 and TRA1-80.
qRT-PCR of pluripotency-related genes; NANOG, OCT4, SOX2, LIN28 and ZFP42 ( REX1). Data are represented as mean ± s.e.m. from n = 3.
DNA methylation profile of OCT4 and NANOG promoters. The global percentage of methylated cytosines (% Me) is indicated (open and closed circles indicate unmethylated and methylated CpGs, respectively).
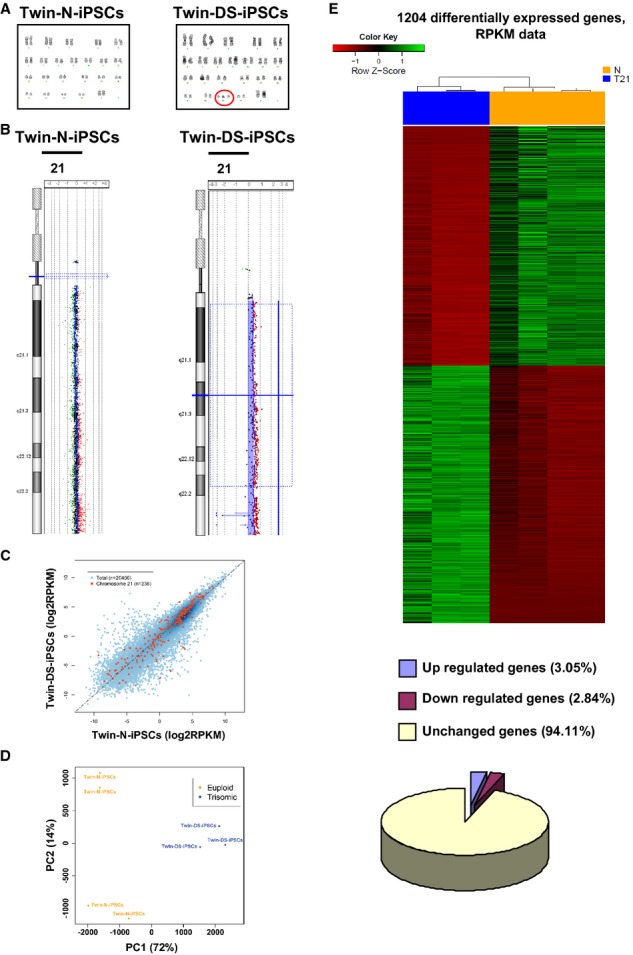
Karyotypes of Twin-N-iPSCs and Twin-DS-iPSCs are 46, XX and 47, XX+21, respectively.
Ideogram and array-CGH profile showing the gain of one DNA copy of chromosome 21 in Twin-DS-iPSCs in comparison with Twin-N-iPSCs.
Comparison of the normalized gene expression levels mean of log2 RPKM between Twin-N-iPSCs and Twin-DS-iPSCs (HSA21 genes are shown in red and the rest of the genome in blue).
Principal component analysis (PCA) plot based on the normalized expression values in Twin-N-iPSCs and Twin-DS-iPSCs. The percentages represent the proportion of variance explained by each component.
Heat map of the normalized gene expression values in Twin-DS-iPSCs and Twin N-iPSCs for the 1204 differentially expressed genes. A negative z-score (in red) indicates low expression (below the mean) whereas a positive z-score (in green) shows high expression (above the mean). Diagram showing the proportion of genes differentially expressed between Twin-N-iPSCs and Twin-DS-iPSCs. See also supplementary Table S2.
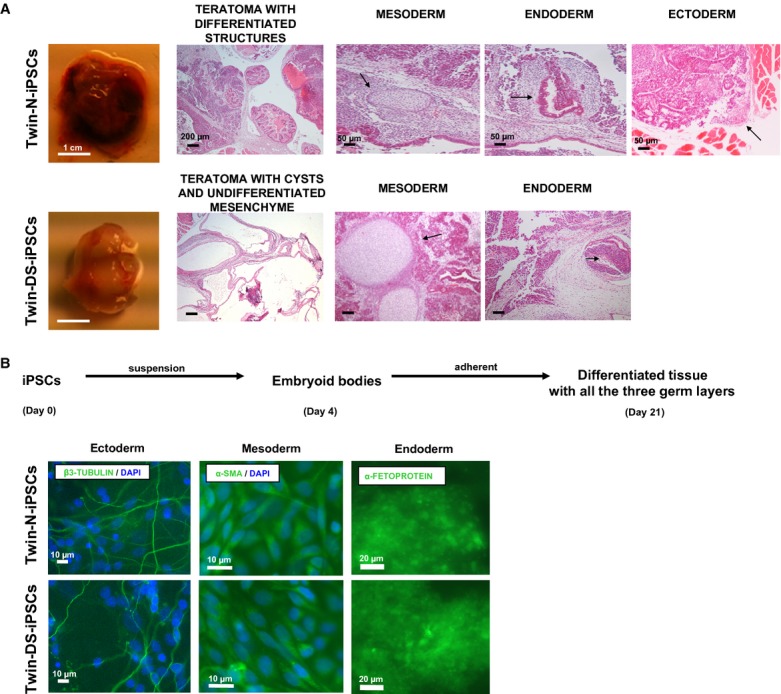
Hematoxylin and eosin staining analysis of teratoma generated after intramuscular injection of Twin-N-iPSCs (upper panel) and Twin-DS-iPSCs (lower panel) into SCID mice. See also supplementary Fig S4.
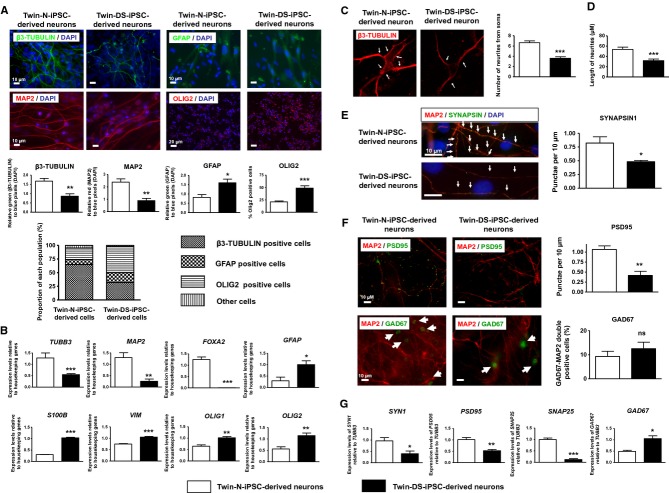
Spontaneous in vitro differentiation of Twin-N-iPSCs (upper panel) and Twin-DS-iPSCs (lower panel) as embryoid bodies (EBs) in suspension culture for 4 days and as adherent cells for an additional 17 days. These EBs expressed α-SMA (mesoderm), AFP (endoderm) and β3-tubulin (ectoderm).
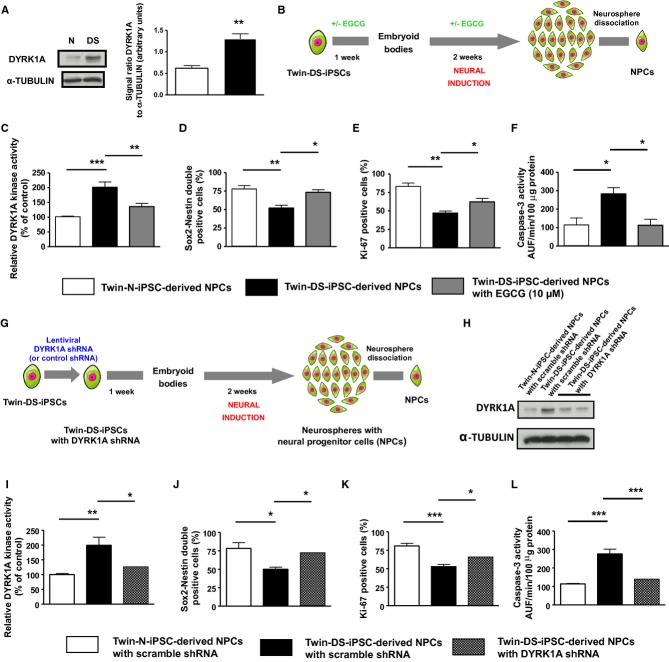
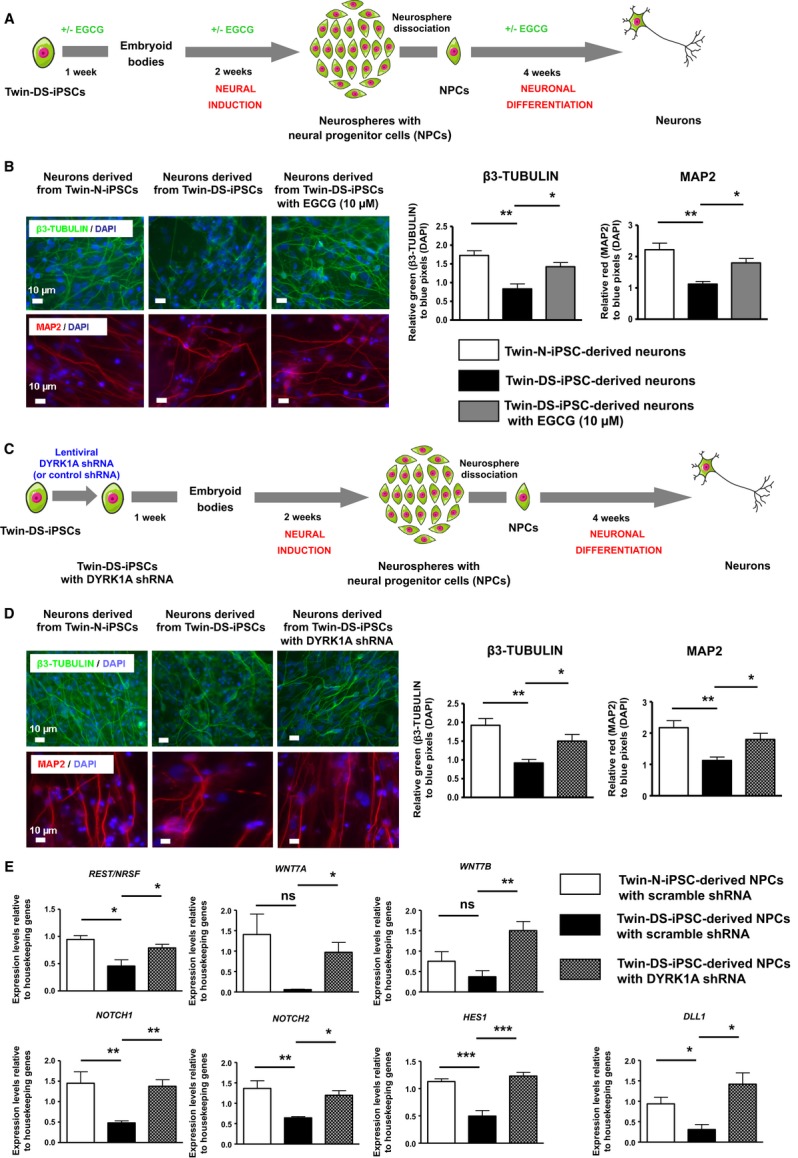
Schematic representation for generation of neurons from Twin-DS-iPSCs after incubation with EGCG 10 μM.
Effect of DYRK1A inhibition by EGCG on the expression of neuronal markers upon neuronal differentiation of Twin-DS-iPSCs. Data are represented as mean ± s.e.m. * P < 0.05, ** P < 0.01 by one-way ANOVA followed with Tukey's test from n = 4.
Schematic representation for generation of neurons from Twin-DS-iPSCs after transduction with lentiviruses encoding shRNAs targeting DYRK1A.
Effect of DYRK1A inhibition through shRNA silencing on the expression of neuronal markers upon neuronal differentiation of Twin-DS-iPSCs. Data are represented as mean ± s.e.m. * P < 0.05, ** P < 0.01 by one-way ANOVA followed with Tukey's test from n = 4.
qRT-PCR of REST/NRSF, WNT7A, WNT7B, NOTCH1, NOTCH2, HES1 and DLL1 in NPCs derived from Twin-N-iPSCs and Twin-DS-iPSCs. The effect of DYRK1A inhibition by shRNA is also shown. Data are represented as mean ± s.e.m. * P < 0.05, ** P < 0.01, *** P < 0.001 by one-way followed with Tukey's test from n = 4–7.
Similar articles
-
Transcriptome and Proteome Profiling of Neural Induced Pluripotent Stem Cells from Individuals with Down Syndrome Disclose Dynamic Dysregulations of Key Pathways and Cellular Functions.Mol Neurobiol. 2019 Oct;56(10):7113-7127. doi: 10.1007/s12035-019-1585-3. Epub 2019 Apr 13. Mol Neurobiol. 2019. PMID: 30989628 Free PMC article.
-
Effect of DYRK1A activity inhibition on development of neuronal progenitors isolated from Ts65Dn mice.J Neurosci Res. 2012 May;90(5):999-1010. doi: 10.1002/jnr.23007. Epub 2012 Jan 18. J Neurosci Res. 2012. PMID: 22252917
-
Modeling neurogenesis impairment in Down syndrome with induced pluripotent stem cells from Trisomy 21 amniotic fluid cells.Exp Cell Res. 2013 Feb 15;319(4):498-505. doi: 10.1016/j.yexcr.2012.09.017. Epub 2012 Oct 4. Exp Cell Res. 2013. PMID: 23041301
-
[Molecular Mechanism Underlying Abnormal Differentiation of Neural Progenitor Cells in the Developing Down Syndrome Brain].Yakugaku Zasshi. 2017;137(7):795-800. doi: 10.1248/yakushi.16-00236-1. Yakugaku Zasshi. 2017. PMID: 28674289 Review. Japanese.
-
Dyrk1a from Gene Function in Development and Physiology to Dosage Correction across Life Span in Down Syndrome.Genes (Basel). 2021 Nov 20;12(11):1833. doi: 10.3390/genes12111833. Genes (Basel). 2021. PMID: 34828439 Free PMC article. Review.
Cited by
-
Bexarotene Impairs Cognition and Produces Hypothyroidism in a Mouse Model of Down Syndrome and Alzheimer's Disease.Front Pharmacol. 2021 Apr 15;12:613211. doi: 10.3389/fphar.2021.613211. eCollection 2021. Front Pharmacol. 2021. PMID: 33935706 Free PMC article.
-
Autonomous trisomic rescue of Down syndrome cells.Lab Invest. 2019 Jun;99(6):885-897. doi: 10.1038/s41374-019-0230-0. Epub 2019 Feb 13. Lab Invest. 2019. PMID: 30760866 Free PMC article.
-
Overexpression of Dyrk1A is implicated in several cognitive, electrophysiological and neuromorphological alterations found in a mouse model of Down syndrome.PLoS One. 2014 Sep 4;9(9):e106572. doi: 10.1371/journal.pone.0106572. eCollection 2014. PLoS One. 2014. PMID: 25188425 Free PMC article.
-
Trisomic rescue via allele-specific multiple chromosome cleavage using CRISPR-Cas9 in trisomy 21 cells.PNAS Nexus. 2025 Feb 18;4(2):pgaf022. doi: 10.1093/pnasnexus/pgaf022. eCollection 2025 Feb. PNAS Nexus. 2025. PMID: 39967679 Free PMC article.
-
Trans effects of chromosome aneuploidies on DNA methylation patterns in human Down syndrome and mouse models.Genome Biol. 2015 Nov 25;16:263. doi: 10.1186/s13059-015-0827-6. Genome Biol. 2015. PMID: 26607552 Free PMC article.
References
-
- Ahn K-J, Jeong HK, Choi H-S, Ryoo S-R, Kim YJ, Goo J-S, Choi S-Y, Han J-S, Ha I, Song W-J. DYRK1A BAC transgenic mice show altered synaptic plasticity with learning and memory defects. Neurobiol Dis. 2006;22:463–472. - PubMed
-
- Altafaj X, Dierssen M, Baamonde C, Martí E, Visa J, Guimerà J, Oset M, González JR, Flórez J, Fillat C, et al. Neurodevelopmental delay, motor abnormalities and cognitive deficits in transgenic mice overexpressing Dyrk1A (minibrain), a murine model of Down's syndrome. Hum Mol Genet. 2001;10:1915–1923. - PubMed
Publication types
MeSH terms
Substances
LinkOut - more resources
Full Text Sources
Other Literature Sources
Medical
Molecular Biology Databases
Research Materials
