. 2014 Feb;6(2):278-94.
doi: 10.1002/emmm.201303373. Epub 2013 Dec 27.

ADAM8 expression in invasive breast cancer promotes tumor dissemination and metastasis

Affiliations

ADAM8 expression in invasive breast cancer promotes tumor dissemination and metastasis

Mathilde Romagnoli et al. EMBO Mol Med. 2014 Feb.

Abstract

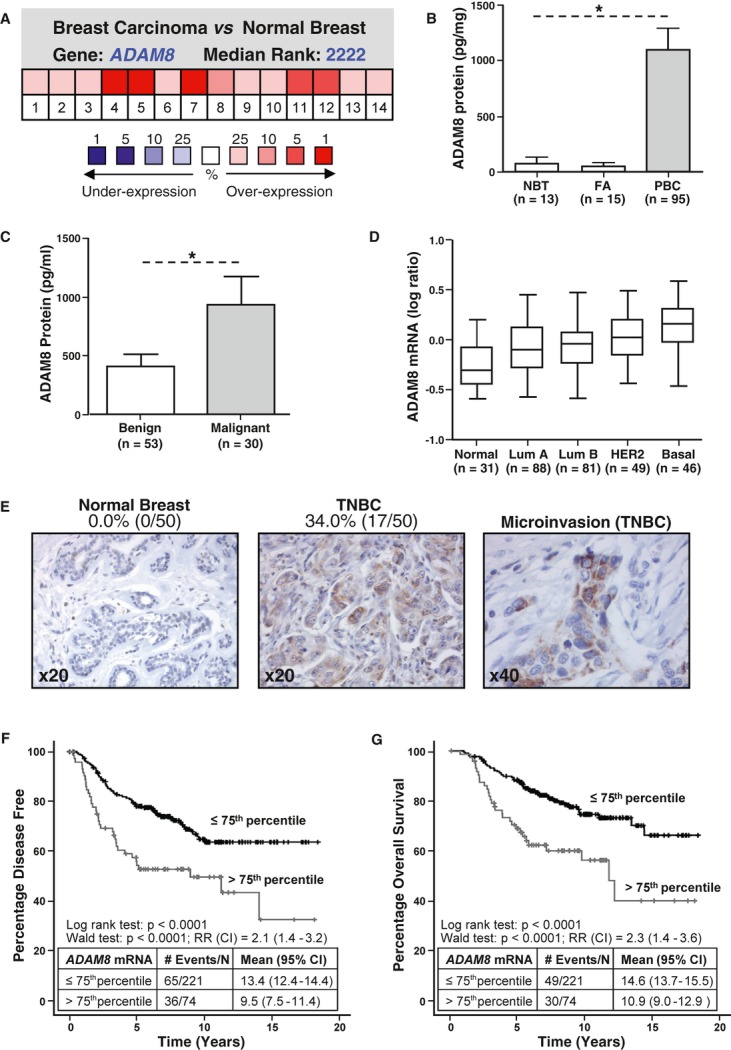
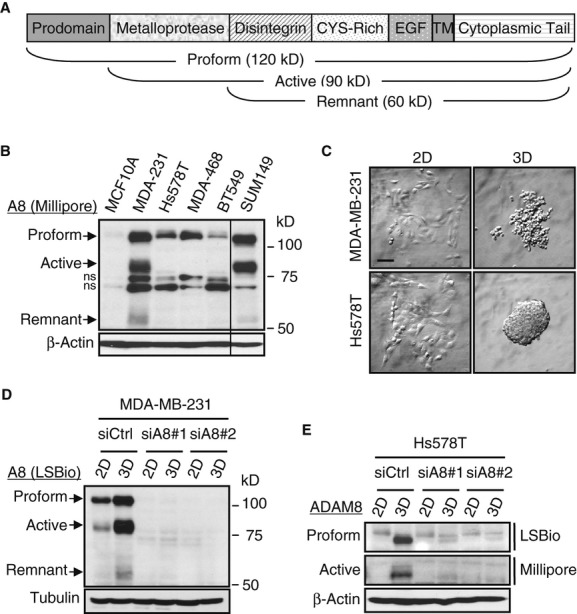
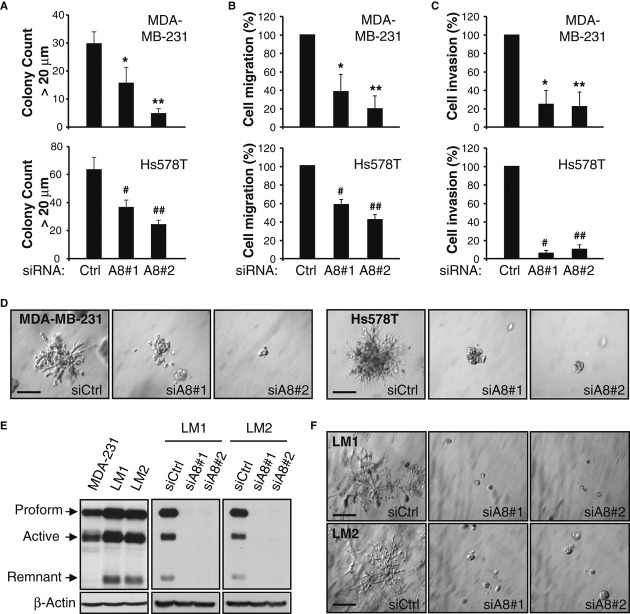
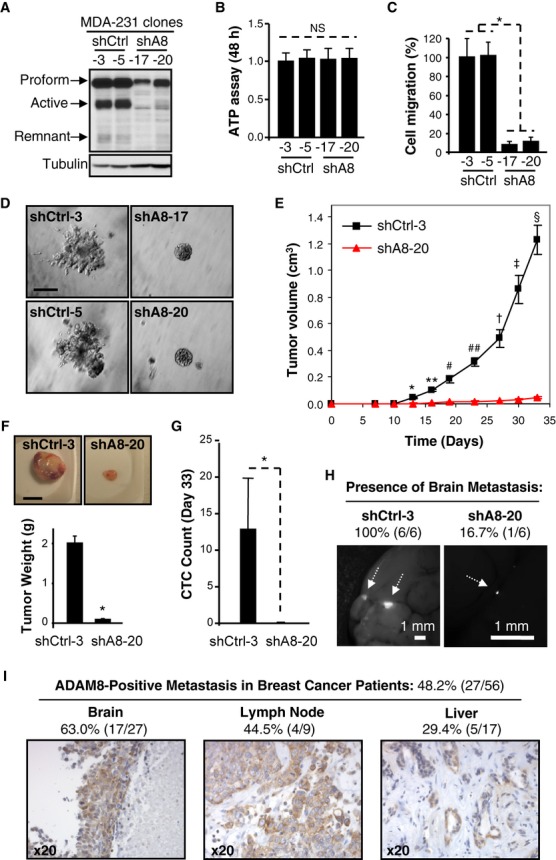
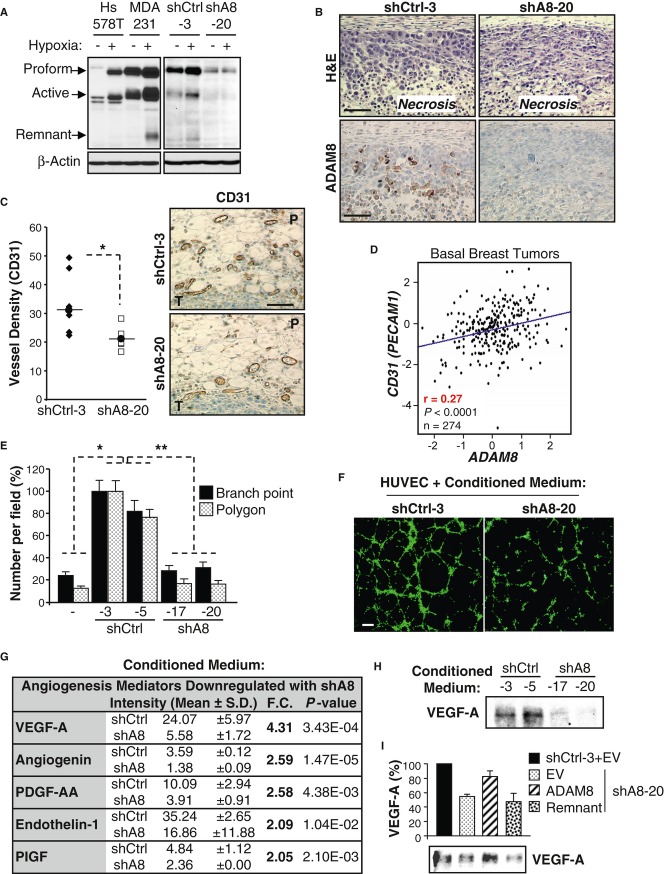
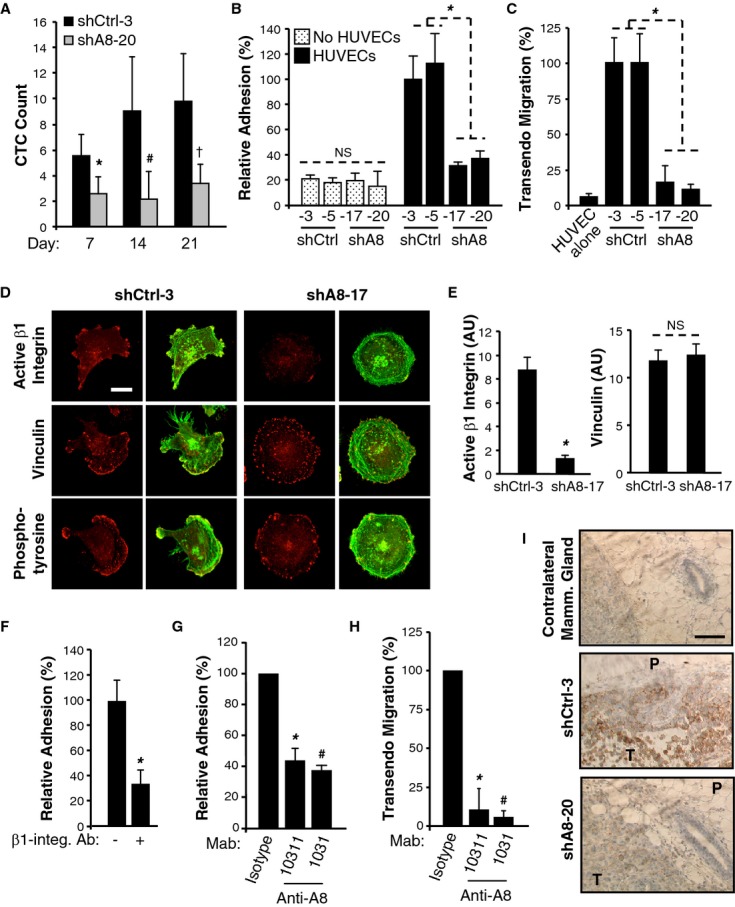
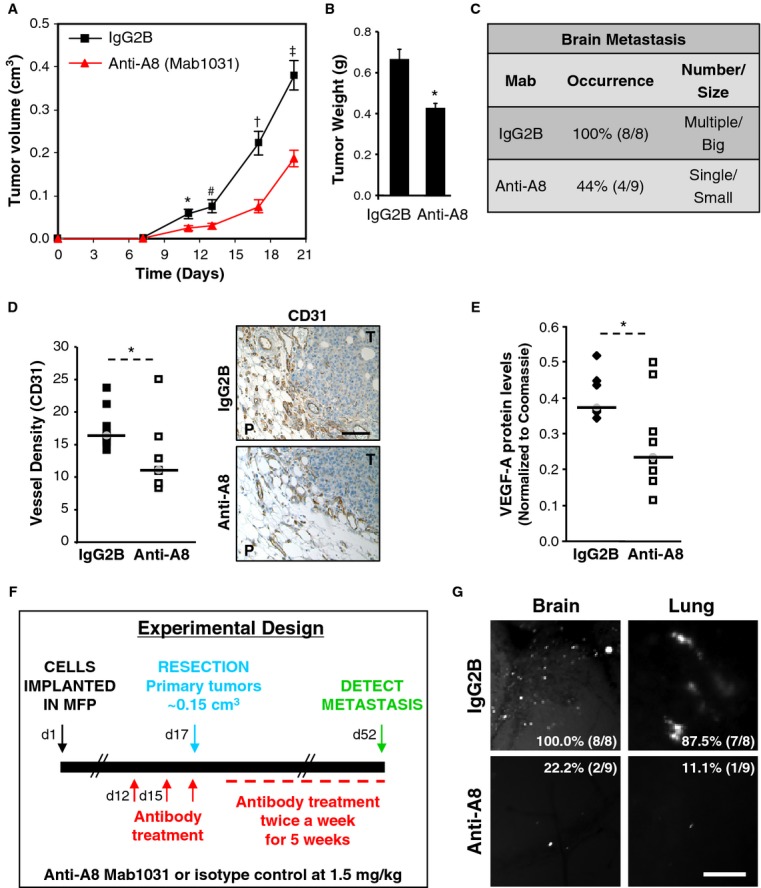
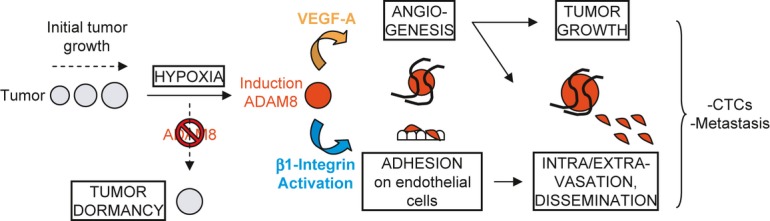
The transmembrane metalloprotease-disintegrin ADAM8 mediates cell adhesion and shedding of ligands, receptors and extracellular matrix components. Here, we report that ADAM8 is abundantly expressed in breast tumors and derived metastases compared to normal tissue, especially in triple-negative breast cancers (TNBCs). Furthermore, high ADAM8 levels predicted poor patient outcome. Consistently, ADAM8 promoted an aggressive phenotype of TNBC cells in culture. In a mouse orthotopic model, tumors derived from TNBC cells with ADAM8 knockdown failed to grow beyond a palpable size and displayed poor vascularization. Circulating tumor cells and brain metastases were also significantly reduced. Mechanistically, ADAM8 stimulated both angiogenesis through release of VEGF-A and transendothelial cell migration via β1-integrin activation. In vivo, treatment with an anti-ADAM8 antibody from the time of cell inoculation reduced primary tumor burden and metastases. Furthermore, antibody treatment of established tumors profoundly decreased metastases in a resection model. As a non-essential protein under physiological conditions, ADAM8 represents a promising novel target for treatment of TNBCs, which currently lack targeted therapies and frequently progress with fatal dissemination.


Figures

Figure 1
Figure 1
A ADAM8 mRNA expression in samples from breast tumor and normal breast tissue was analyzed using the Oncomine microarray database. Pooling of 14 analyses from six different microarray studies shows ADAM8 is one of the more highly expressed genes in breast cancer versus normal tissue. P = 0.025, Student's t-test. B, C ADAM8 protein levels were measured by ELISA in samples from adjacent normal breast tissue (NBT), fibroadenoma (FA) and primary breast carcinoma (PBC) (B), and in serum of patients with either benign or malignant breast disease (C). * P < 0.0001, Kruskal–Wallis test (B); * P = 0.034, Mann–Whitney U-test (C). D ADAM8 mRNA expression was analyzed across the different molecular breast cancer subtypes in the van de Vijver microarray dataset, which includes 295 primary breast tumors from normal-like (Normal), luminal A (Lum A), luminal B (Lum B), HER2, and basal-like (Basal) subtypes (van de Vijver et al, 2002). * P < 0.0001 for Basal versus other groups, Kruskal–Wallis test. E Representative pictures of ADAM8 staining analyzed by immunohistochemistry in adjacent normal epithelial tissue and primary TNBC samples from 50 patients or areas of microinvasion. Percentages of ADAM8-positive samples are given. F, G Kaplan–Meier curves show the percentage of disease-free survival (F) and overall survival (G) for 295 patients with primary breast cancer stratified based on ADAM8 mRNA levels using the 75th percentile. P < 0.0001, Log-rank test (RR, relative risk, CI, confidence interval).
Figure 2
Figure 2
A Schematic representation of ADAM8 protein with its domains, processed forms and molecular weights indicated. CYS-Rich: cysteine-rich, EGF: EGF-like, TM: transmembrane domains. B Whole-cell extracts (WCEs) from human non-tumoral MCF-10A cells and the indicated TNBC cell lines were examined by WB for ADAM8 expression (Millipore antibody), and for β-Actin as a loading control. A representative blot is shown ( n = 3). All lanes were from the same gel, but cut to re-align as indicated by the vertical line. ADAM8 forms and MW markers are indicated. ns: non-specific band. MDA-231: MDA-MB-231. MDA-468: MDA-MB-468. C Cells were grown in adherent (2D) or suspension cultures on ultra low-attachment plates (3D) for 48 h. In suspension, MDA-MB-231 and Hs578T cells form spheres. Bar: 100 μm. D, E MDA-MB-231 (D) and Hs578T (E) cells were transfected with either Control siRNA (siCtrl) or two specific ADAM8 siRNAs (siA8) for 24 h. Cells were then plated in 2D-or 3D-culture as described in (C). WCEs were subjected to WB for ADAM8 using only LSBio antibody (D), or using both LSBio and Millipore antibodies (E). As a loading control, Tubulin (D) or β-Actin (E) was used. Representative blots are shown ( n = 3).
Figure 3
Figure 3
A–D Cells were transfected with siRNAs as in Fig 2D and E for 24 h, and tested for colony formation in soft agar (A), cell migration (B), invasion (C), and 3D-Matrigel outgrowth (D). For soft agar assays, cells were grown for 8-12 days and colonies >20 μm diameter in 3 wells/condition were counted with ImageJ software. A representative of two experiments with similar results is shown. * P = 0.002, ** P = 1.9E-6, # P = 1.3E-5, ## P = 1.0E-7, Student's t-test (A). Migration (B) and invasion (C) assays were performed for 24 h using Transwells without or with precoating of Matrigel, respectively. Control condition (siCtrl) is set to 100% (mean ± s.d. from three independent experiments). * P = 0.004, ** P = 5.3E-4, # P = 1.8E-4, ## P = 5.5E-5, Student's t-test (B). * P = 0.001, ** P = 9.3E-4, # P = 8.7E-6, ## P = 4.6E-5, Student's t-test (C). For Matrigel outgrowth assays, colonies formed after 5-7 days were photographed at 20× magnification. Experiments were done twice with similar results. Bars: 100 μm (D). E WCEs from MDA-MB-231 cells and in vivo derived LM1 and LM2 lines, either untransfected (left panel) or transfected with siCtrl or siA8 for 48 h (right panels), were subjected to WB for ADAM8 (LSBio antibody). A representative blot is shown ( n = 3). F Twenty-four h after siRNA transfection, LM1 and LM2 cells were subjected to a 3D-Matrigel outgrowth assay, as in (D), except that colonies were photographed after 4 days. Experiments were done twice with similar results. Bars: 100 μm.
Figure 4
Figure 4
A–D Stable ADAM8 KD (shA8) clones were characterized in vitro. ADAM8 expression in WCEs from two shA8 clones (shA8-17 and shA8-20) were compared with two shCtrl clones (shCtrl-3 and shCtrl-5) using WB (LSBio antibody) (A). Clones were grown in 2D-cultures for 48 h and subjected to an ATP assay. NS: non significant, Student's t-test, n = 3 (B). Migration assays were performed as described in Fig 3B. * P = 6.8E-14, Student's t-test, n = 3 (C). Matrigel outgrowth assays were performed as in Fig 3D. Experiments were done twice with similar results. Bar: 100 μm (D). E–H MDA-MB-231 derived shCtrl-3 and shA8-20 cells were injected into the MFP of female mice ( n = 7/group). Tumor volume was measured twice a week (mean ± s.e.m.). * P = 1.4E-6, ** P = 9.8E-8, # P = 3.0E-5, ## P = 9.7E-7, P = 1.7E-5, P = 5.1E-6, § P = 2.0E-7, Student's t-test (E). At the end of the experiment, tumors were photographed and weighed (mean ± s.e.m.). * P = 5.6E-8, Student's t-test. Bar: 1 cm (F). Blood was collected by cardiac puncture and GFP-positive CTCs were detected by flow cytometry. Average CTC count ± s.d. is given per μl of blood. * P = 0.006, Student's t-test (G). Presence of brain metastases was examined by fluorescent microscopy ( n = 6/group). Representative photographs are shown. Bars: 1 mm (H). I ADAM8 expression in distant metastases of breast cancer patients ( n = 56) was analyzed by immunohistochemistry. Representative pictures and percentages of ADAM8-positive samples are presented.
Figure 5
Figure 5
A Sixteen h after plating, cells were cultured under normoxic (−) or hypoxic (+, 1% O2) conditions for 24 h (MDA-MB-231 and Hs578T) or 6 h (shCtrl-3 and shA8-20 clones). WCEs were subjected to WB for ADAM8 (LSBio antibody). Representative blots are shown ( n = 3). B ADAM8 expression in mouse mammary tumors derived from shCtrl-3 or shA8-20 cells was analyzed by immunohistochemistry. H&E staining was performed in parallel. Representative panels are shown ( n = 7/group). Bar: 100 μm. C Angiogenesis was evaluated by CD31 immunohistochemical staining of tumor sections from shCtrl-3 and shA8-20 groups ( n = 7/group). Vessel density for each mouse is given as the average number of vessels in 2 slides/tumor (3 peritumoral hot spots/slide). P: Peritumoral area, T: Tumor. Bar: 100 μm. * P = 0.01, Student's t-test. D Pearson's pairwise correlation plot shows a significant positive correlation between ADAM8 and CD31 (PECAM1) mRNA expression in tumors from patients with basal-like breast cancer (GenExMiner microarray database). r: correlation ratio. P < 0.0001, Student's t-test. E, F HUVECs were subjected to tube formation assays in the presence of conditioned medium from the indicated shA8 and shCtrl clones, or obtained in absence of tumor cells (−). Values for branch points and closed networks (polygons) are given as averages of nine fields ± s.d. Branch point: * P = 1.3E-6 versus shCtrl-3, * P = 3.2E-9 versus shCtrl-5, ** P = 6.9E-29; Polygons: * P = 5.2E-6 versus shCtrl-3, * P = 1.3E-6 versus shCtrl-5, ** P = 6.2E-24; Student's t-test; n = 4 (E). Representative images from 4 independent experiments are shown. Bar: 30 μm (F). G Conditioned media from two shCtrl and two shA8 clones were subjected to a Human Angiogenesis antibody array. Expression levels of the detected proteins were quantified using ImageJ and the angiogenesis mediators significantly downregulated by more than 2-fold in shA8 clones are presented as mean of the two clones ± s.d. Fold change (F.C.) and P-values are given, Student's t-test. H Conditioned serum-free medium from shCtrl and shA8 clones was analyzed by WB for VEGF-A. A representative blot is shown ( n = 3). I VEGF-A in the conditioned serum-free medium from shCtrl-3 or shA8-20 clones transfected with the indicated ADAM8 forms or empty vector (EV) DNA was assessed by WB (lower panel). The quantification of average levels from 3 experiments is presented as percent relative to the shCtrl set to 100%.
Figure 6
Figure 6
A Blood was drawn using the submandibular collection method from 4 mice/group on the indicated days after tumor cell implantation into the MFP and subjected to flow cytometry to measure GFP-positive CTCs. Average count for the 4 mice ± s.d. per μl of blood is given for each time point. * P = 0.03, # P = 0.05, P = 0.02, Student's t-test. B Cells were incubated, in duplicate, on a HUVEC monolayer or in empty wells. Attached cells were counted in three fields per well. Mean ± s.d. from three independent experiments. NS, non significant, * P = 1.6E-6, Student's t-test. C Cells were subjected to an overnight transendothelial migration assay on HUVECs. Mean ± s.d. from three independent experiments. * P = 1.7E-5, Student's t-test. D, E Cells were plated on fibronectin-coated coverslips, stained with antibodies against active β1-integrin, vinculin or phosphotyrosine (focal adhesions markers) and phalloidin-488 (F-actin). Confocal microscopy images show adhesion protein channel (red) or merge with F-actin (green). Bar: 10 μm (D). Signal intensity for active β1-integrin and vinculin was determined using ImageJ software (arbitrary units). Mean intensity ± s.d. from >20 cells over 2 experiments. * P = 1.4E-4, NS, non significant, Student's t-test (E). F Adhesion of shCtrl-3 cells on HUVECs was assessed as in (B) with prior incubation of shCtrl-3 cells with an antagonist β1-integrin antibody (+) or a control isotype (−). Mean ± s.d. from three independent experiments. * P = 3.0E-5, Student's t-test. G, H Adhesion (G) and transendothelial migration (H) of shCtrl-3 cells on HUVECs was assessed as in B and C, respectively. Prior to the assays, shCtrl-3 cells were incubated either with monoclonal antibodies targeting the ectodomain of ADAM8 (Mab10311 or Mab1031) or an appropriate isotype control (IgG1 or IgG2B, respectively). The transmigration assay was performed for 9 h. Mean ± s.d. from three independent experiments. * P = 0.001, # P = 5.0E-4, Student's t-test (G). * P = 6.3E-7, # P = 4.0E-7, Student's t-test (H). I Active β1-integrin expression was assessed by immunohistochemistry in mouse mammary tumors (shCtrl-3 and shA8-20) and contralateral mammary glands (shCtrl-3) ( n = 7/group). P: Peritumoral area, T: Tumor. Bar: 100 μm.
Figure 7
Figure 7
A–E MDA-MB-231 shCtrl-3 cells were injected into the MFP of female mice. Animals were treated with either 0.5 mg/kg anti-ADAM8 (anti-A8, Mab1031, n = 9) or isotype-matched control (IgG2B, n = 8) in i.p. injection twice weekly. Tumor volume was measured on the indicated days (mean ± s.e.m.). * P = 0.02 (day 11), # P = 0.01 (day 13), P = 2.1E-4 (day 17), P = 1.5E-4 (day 20), Student's t-test (A). At the end of the experiment, tumors were weighed (mean ± s.e.m.). * P = 5.8E-4, Student's t-test (B) and the presence of brain metastases was examined by fluorescent microscopy (C). Angiogenesis was evaluated by CD31 immunohistochemical staining of tumor sections. Vessel density for each mouse is given as the average number of vessels in 2 slides/tumor (5 peritumoral hot spots/slide) and representative pictures are shown (D). P: Peritumoral area, T: Tumor. Bar: 100 μm. VEGF-A levels in the tumor extracts were determined by WB and normalized to Coomassie staining (E). * P = 0.04 (D), * P = 0.03 (E), Student's t-test. F–G Scheme of experimental design (F). Metastases to the brain and lungs were examined by fluorescent microscopy. Representative images and frequency of metastases (percentage of animals positive per group: IgG2B, n = 8; anti-A8, n = 9) are presented (G). Bar: 250 μm.
Figure 8
Figure 8
When solid tumors reach a few millimeters in diameter, hypoxic stress is induced, which leads to ADAM8 induction resulting in strong pro-angiogenic signaling, in part via VEGF-A release into the extracellular compartment, and endothelial cell recruitment. ADAM8 also promotes β1-integrin activation on tumor cells needed for their adhesion onto and transmigration through the blood vessel wall, which supports dissemination of CTCs and development of metastases. Importantly, here we demonstrate that if the induction of ADAM8 is blocked or its activity inhibited with antibody, there is an insufficient angiogenic response, leading to tumor mass dormancy or slowing of growth, as well as to a striking reduction of CTCs and metastases.

Similar articles

Cited by

References

    1. Adams RH, Alitalo K. Molecular regulation of angiogenesis and lymphangiogenesis. Nat Rev Mol Cell Biol. 2007;8:464–478. - PubMed
    1. Avraamides CJ, Garmy-Susini B, Varner JA. Integrins in angiogenesis and lymphangiogenesis. Nat Rev Cancer. 2008;8:604–617. - PMC - PubMed
    1. Baren JP, Stewart GD, Stokes A, Gray K, Pennington CJ, O'Neill R, Deans DA, Paterson-Brown S, Riddick AC, Edwards DR, et al. mRNA profiling of the cancer degradome in oesophago-gastric adenocarcinoma. Br J Cancer. 2012;107:143–149. - PMC - PubMed
    1. Bartsch JW, Wildeboer D, Koller G, Naus S, Rittger A, Moss ML, Minai Y, Jockusch H. Tumor necrosis factor-alpha (TNF-alpha) regulates shedding of TNF-alpha receptor 1 by the metalloprotease-disintegrin ADAM8: evidence for a protease-regulated feedback loop in neuroprotection. J Neurosci. 2010;30:12210–12218. - PMC - PubMed
    1. Bergers G, Benjamin LE. Tumorigenesis and the angiogenic switch. Nat Rev Cancer. 2003;3:401–410. - PubMed

Publication types

MeSH terms