. 2014 Apr;42(6):e40.
doi: 10.1093/nar/gkt1287. Epub 2013 Dec 26.

Redirecting splicing with bifunctional oligonucleotides

Affiliations

Redirecting splicing with bifunctional oligonucleotides

Jean-Philippe Brosseau et al. Nucleic Acids Res. 2014 Apr.

Abstract

Ectopic modulators of alternative splicing are important tools to study the function of splice variants and for correcting mis-splicing events that cause human diseases. Such modulators can be bifunctional oligonucleotides made of an antisense portion that determines target specificity, and a non-hybridizing tail that recruits proteins or RNA/protein complexes that affect splice site selection (TOSS and TOES, respectively, for targeted oligonucleotide silencer of splicing and targeted oligonucleotide enhancer of splicing). The use of TOSS and TOES has been restricted to a handful of targets. To generalize the applicability and demonstrate the robustness of TOSS, we have tested this approach on more than 50 alternative splicing events. Moreover, we have developed an algorithm that can design active TOSS with a success rate of 80%. To produce bifunctional oligonucleotides capable of stimulating splicing, we built on the observation that binding sites for TDP-43 can stimulate splicing and improve U1 snRNP binding when inserted downstream from 5' splice sites. A TOES designed to recruit TDP-43 improved exon 7 inclusion in SMN2. Overall, our study shows that bifunctional oligonucleotides can redirect splicing on a variety of genes, justifying their inclusion in the molecular arsenal that aims to alter the production of splice variants.


Figures

Figure 1.
Figure 1.
Impact of TOSS on the production of apoptotic splice variants. (A) Schematic representation of the Bcl-x splicing unit and the location of Bclx–TOSS1. (B) Positions of the PCR primers used to quantify splice variants of Bcl-x. (C) Histograms representing average percentage values obtained by endpoint RT-PCR (upper panel) or the relative expression of variants by quantitative RT-PCR (bottom panel) in three biological replicates. PC-3 cells were transfected with Bclx–TOSS1 (400 nM final concentration) or a control TOSS carrying an antisense sequence not complementary to Bcl-x (ctrl–TOSS). Total RNA was extracted with Trizol 24 h later. (D) Western analysis of TOSS-induced shifts in CASP protein isoforms. HeLa cells were transfected with CASP8–TOSS1 and a mutated version (ctrl–TOSS) containing four mismatches (upper panel) or CASP10–TOSS1 and a mutated version (ctrl–TOSS) containing two mismatches (bottom panel). Proteins were extracted 72 h later, and the proportion of the splice variants was verified by western analysis.
Figure 2.
Figure 2.
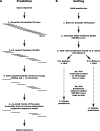
Development of the algorithm for designing TOSS. An application programming interface (API) and web application was developed using Perl version 5.8.8 (the Perl directory http://www.perl.org/) with CGI::Application, HTML::Template and Bioperl CPAN modules (CPAN: Comprehensive Perl Archive Network, http://cpan.org/). (A) To perform TOSS prediction, the user specifies the alternative exon sequence. The algorithm then extracts all possible sequences from the target sequence using a window of 20 nucleotides. Each 20mer is evaluated for valid GC content (between 30% and 80%), the absence of four consecutive identical nucleotides, and of immune stimulatory responses sequence motifs (39–42), and self-complementarity of the sequence (ΔG higher than −9.4 kcal/mol). Self-complementarity minimum energy folding was calculated using the hybrid-ss-min software included in the UNAFold package (38) using default parameters. The ΔG threshold was determined by calculating the average and standard deviation of 10 000 randomly generated 20mer sequences located at the 5′ end of TOSS. The threshold was fixed as the average plus two standard deviations to ensure that no strong intramolecular folding structure (lower than −9.4 kcal/mol) was formed. (B) Predictions that meet the above criteria’s are then sorted according to different filters. First, each prediction is submitted to a Blast analysis (43) against an in silico generated transcriptome database derived from the Aceview annotation (44). This step is performed to determine potential off-targets associated with the hybridizing portion of the TOSS. Second, the sequence complementary to the hybridizing portion of the TOSS is evaluated for the potential presence of splicing enhancer (ESE) and splicing silencer (ESS) motif sequences. To perform this step, each nucleotide found in the input sequence was scored against a database of potential ESE and ESS motifs previously identified by Stadler et al. (45). If the nucleotide is part of an ESE or an ESS motif, the nucleotide score is increased or decreased by 1, respectively. The TOSS prediction is then attributed a global ESE/ESS score representing the sum of the nucleotides. Then, valid predictions are separated in two pools based on 5′ss distances; the first and second pool being, respectively, below and above a distance of 30 nucleotides from the 5′ splice junction. Once all filters are computed, both pools are then ordered to favor predictions with the least potential off-targets and the highest global ESE/ESS score to maximize disruption of potential enhancers. Finally, predictions from the pool closest to the 5′ss (<30 nucleotides) are favored over the long distance pool. The program web application can be accessed at http://toss.lgfus.ca.
Figure 3.
Figure 3.
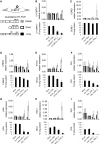
Effect of TOSS versus ASO. (A) Schematic representation of a standard cassette exon. The positions of qRT-PCR primers are indicated. (B–I) SKOV3ip1 cells were transfected with specific TOSS, their ASO versions (lacking a tail) and a control TOSS carrying no complementarity to the targeted gene. Total RNA was extracted 24 h later using Absolutely RNA 96 Microprep kit (Stratagene). Histograms represent average relative values for global expression (dark gray), short isoform (white) and the long isoform (black) obtained by quantitative RT-PCR in three biological replicates (upper portion of each panel). The quantitative RT-PCR values for the short and long isoforms were output as percentage of long variant for each condition (lower portion of each panel) using calculations described previously (32).
Figure 4.
Figure 4.
Impact of the distance relative to 5′ss on TOSS activity. (A) Schematic representation of MCL1 (left panel) and SHMT1 (right panel) cassette exon and the relative positions of TOSS to 5′ss. (B) SKOV3ip1 cells were transfected with TOSS harboring sequences complementary to various positions upstream of a 5′ss of the two genes (MCL1 and SHMT1) and a control TOSS carrying no complementarity to the targeted genes (MCL1_TOSS_2 position −38; MCL1_TOSS_3 position −31; MCL1_TOSS_1 position −2; SHMT1_TOSS_2 position −58; SHMT1_TOSS_3 position −49 and SHMT1_TOSS_1 position 0). Total RNA was extracted 24 h later using Absolutely RNA 96 Microprep kit (Stratagene). Histograms represent average relative values for global expression (dark gray), short isoform (white) and the long isoform (black) obtained by quantitative RT-PCR in three biological replicates (upper panel). (C) Histograms represent average percentage values obtained by end-point PCR in three biological replicates.
Figure 5.
Figure 5.
Using TOSS to redirect splicing in a complex unit carrying alternative 5′ss. (A) Schematic representation of the NUP98 alternative splicing unit as well as the position of NUP98–TOSS1 and NUP98–TOSS2 on the 222 nt exon. (B) Positions of primers used to amplify splice variants of NUP98 in endpoint and quantitative PCR assays. (C) SKOV3ip1 cells were transfected with NUP98–TOSS1, NUP98–TOSS2, their ASO versions (lacking a tail), and a control TOSS and ASO carrying no complementarity to NUP98 (ctrl–TOSS and ctrl–ASO, respectively). Total RNA was extracted with Trizol 24 h later. Histograms representing average percentage values of the long variant obtained by endpoint PCR in three biological replicates are depicted. (D) SKOV3ip1 cells were transfected with NUP98–TOSS1, NUP98–TOSS2 and a control TOSS carrying an antisense sequence not complementary to NUP98 (ctrl–TOSS). Total RNA was extracted 24 h later using the Absolutely RNA 96 Microprep kit (Stratagene). Histograms represent average relative values for global expression (dark gray) and the short (white) splice variant obtained by quantitative RT-PCR in three biological replicates.
Figure 6.
Figure 6.
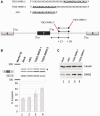
Impact of TDP-43 binding sites on splicing. (A) The Dup 5.1 minigene was used as model (47). The (−/−) is the wild-type version that contains an alternative cassette exon, while the (+/−) version contains a (UG)13 element (TBS) in the first intron, 90 nt downstream from the 5′ss and 47 nt upstream of the 3′ss of the internal exon. (B) In vivo splicing of (−/−) and (+/−) in induced (I shTDP-43) and non-induced (NI) HeLa/shTDP-43 cells. Following an induction or mock-induction period of 48 h with doxycycline, plasmids were transfected and RNA collected 24 h later. RT-PCR products were fractionated on denaturing acrylamide gels, and the relative level of exon inclusion was calculated from biological triplicates. (C) Western analysis of TDP-43 expression in the induced (I shTDP-43) and NI HeLa/shTDP-43 cell line following doxycycline induction for the times indicated.
Figure 7.
Figure 7.
TDP-43 stimulates U1 snRNP binding. (A) Structure of the model pre-mRNAs used to determine the in vitro impact of a binding site for TDP-43 [TBS made up of (UG)13] on 5′ss selection. The 553 (−/−) pre-mRNA carries two competing 5′ss (distal and proximal). The 553 (+/−) pre-mRNA derivative carries a (UG)13 TBS element 30 nt downstream of the distal 5′ss. (B) In vitro splicing of the two model pre-mRNAs for 90 min in a HeLa nuclear extract. The percentage of skipping of the proximal 5′ss is indicated. (C) Uniformly radiolabeled transcripts are incubated 0, 5 or 20 min at 30°C in a HeLa nuclear extract. Two DNA oligonucleotides complementary to each 5′ss are added along with RNase H which will cut the RNA moiety of the DNA:RNA duplex. Transcripts are therefore cut when U1 is not bound to the 5′ss. Cleavage products are separated on a denaturing acrylamide gel. The bands corresponding to double protection, proximal 5′ss protection only or distal 5′ss protection only are quantitated on PhosphorImager. The table indicates the normalized percentage of U1 snRNP occupancy at both 5′ss, at only the proximal 5′ss or only the distal 5′ss after incubation for 0, 5 and 20 min in a HeLa nuclear extract at 30°C.
Figure 8.
Figure 8.
TOES-mediated exon inclusion on SMN2 transcripts. (A) A portion of the SMN2 gene was targeted with TDP-43-TOES complementary to positions +21 to +35 downstream of exon 7. The portion of the oligos complementary to SMN2 is underlined. (B) RNA was extracted 48 h post-transfection. Computerized versions of electropherograms are shown as well as a histogram with standard deviations derived from biological triplicates. Primers used for SMN2 amplification were 54C618 (sense) 5′-CTCCCATATGTCCAGATTCTCTT-3′ and 541C1120 (antisense) 5′-CTACAACACCCTTCTCACAG-3′. The position, structure and size of the amplification products corresponding to the splice variants are shown. The identity of the doublet bands (*) migrating above the two SMN2 splice products is unknown. The graph displays the inclusion frequency (in percentage) of SMN2 exon 7 based on biological triplicates. (C) Expression of the SMN2 protein was analyzed in one set by western blot 72 h after transfection with using anti-human SMN antibodies (BD Transduction Labs).

References

    1. Pan Q, Shai O, Lee LJ, Frey BJ, Blencowe BJ. Deep surveying of alternative splicing complexity in the human transcriptome by high-throughput sequencing. Nat. Genet. 2008;40:1413–1415. - PubMed
    1. Wang ET, Sandberg R, Luo S, Khrebtukova I, Zhang L, Mayr C, Kingsmore SF, Schroth GP, Burge CB. Alternative isoform regulation in human tissue transcriptomes. Nature. 2008;456:470–476. - PMC - PubMed
    1. Djebali S, Davis CA, Merkel A, Dobin A, Lassmann T, Mortazavi A, Tanzer A, Lagarde J, Lin W, Schlesinger F, et al. Landscape of transcription in human cells. Nature. 2012;489:101–108. - PMC - PubMed
    1. Nilsen TW, Graveley BR. Expansion of the eukaryotic proteome by alternative splicing. Nature. 2010;463:457–463. - PMC - PubMed
    1. Tazi J, Bakkour N, Stamm S. Alternative splicing and disease. Biochim. Biophys. Acta. 2009;1792:14–26. - PMC - PubMed

Publication types