. 2014 May;32(5):1195-207.
doi: 10.1002/stem.1616.

Ectopic Ptf1a expression in murine ESCs potentiates endocrine differentiation and models pancreas development in vitro

Affiliations

Ectopic Ptf1a expression in murine ESCs potentiates endocrine differentiation and models pancreas development in vitro

Gopika G Nair et al. Stem Cells. 2014 May.

Abstract

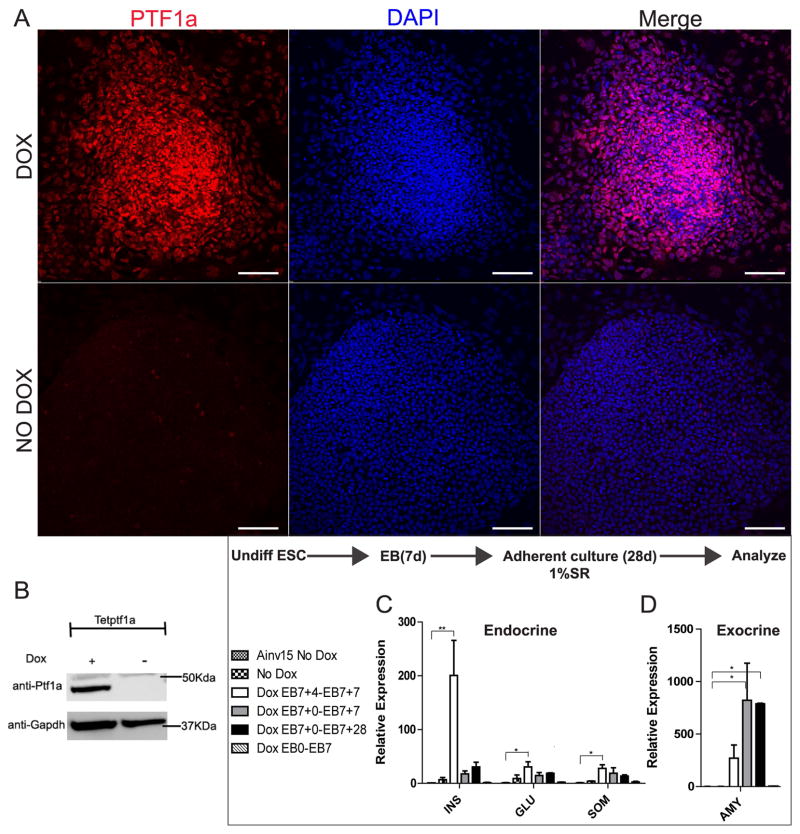
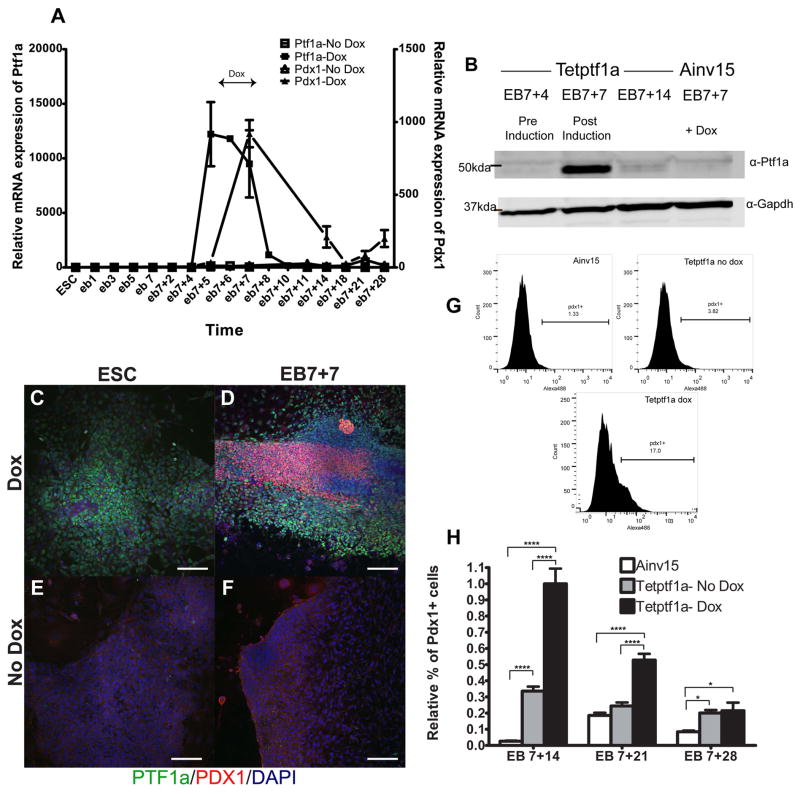
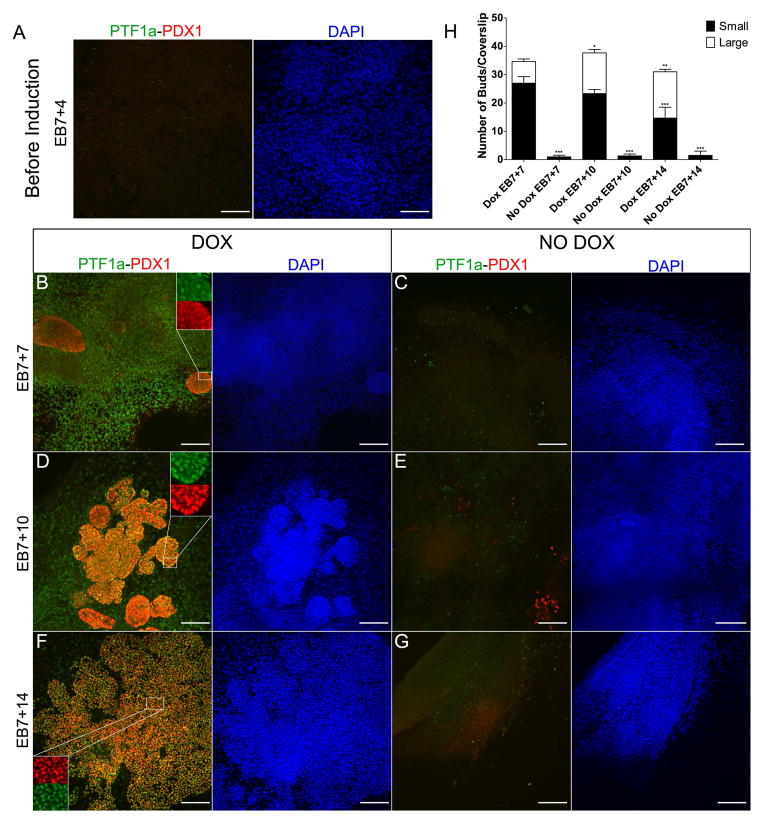
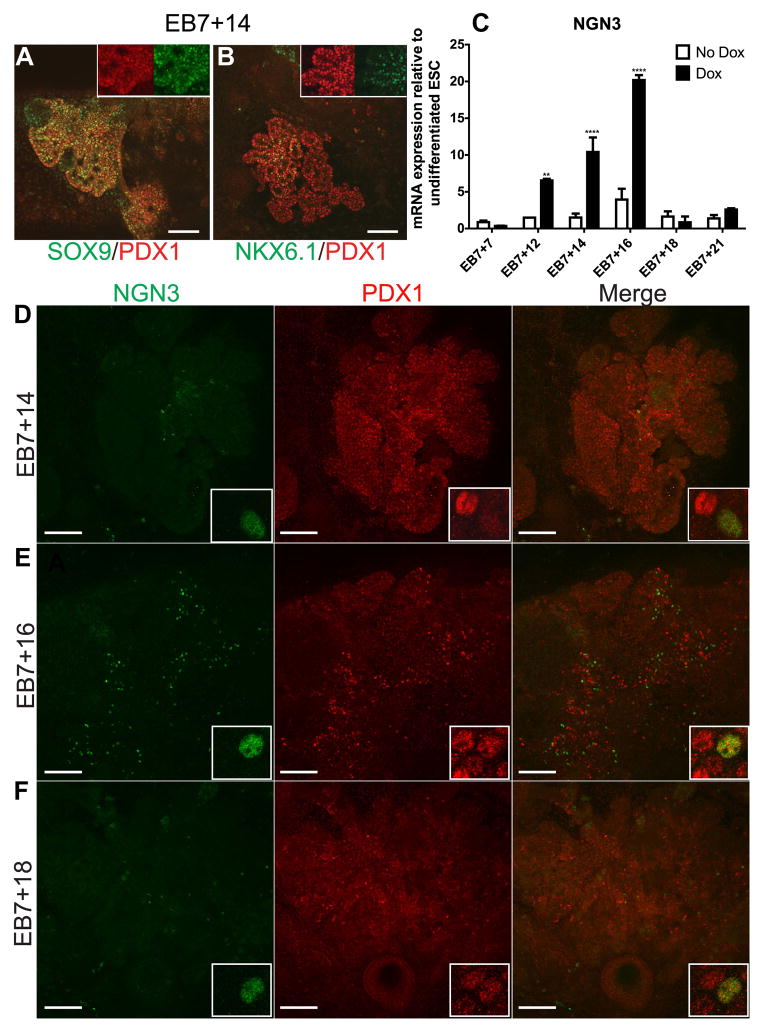
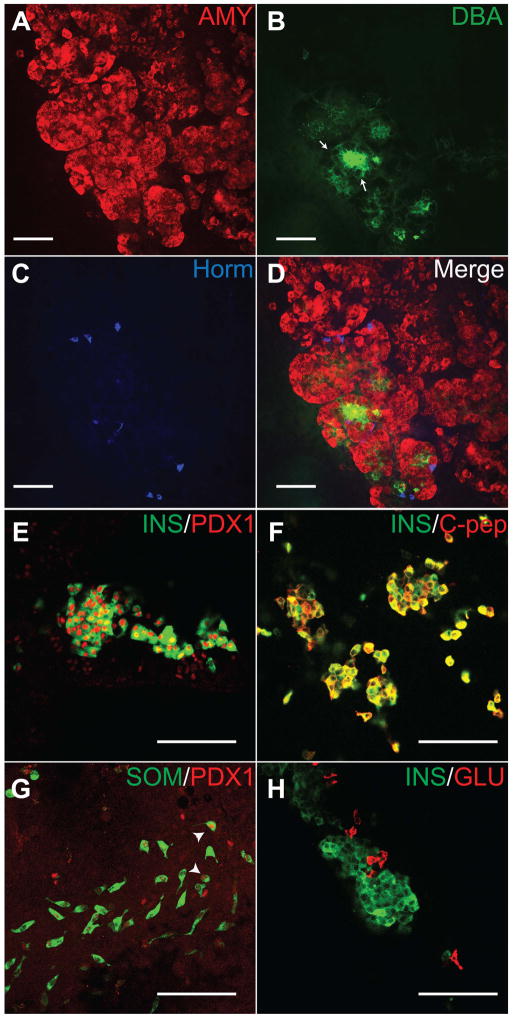
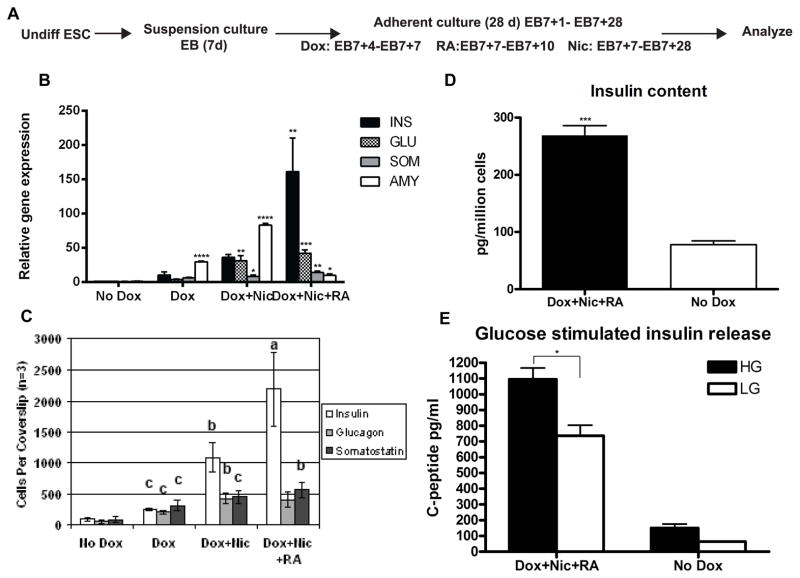
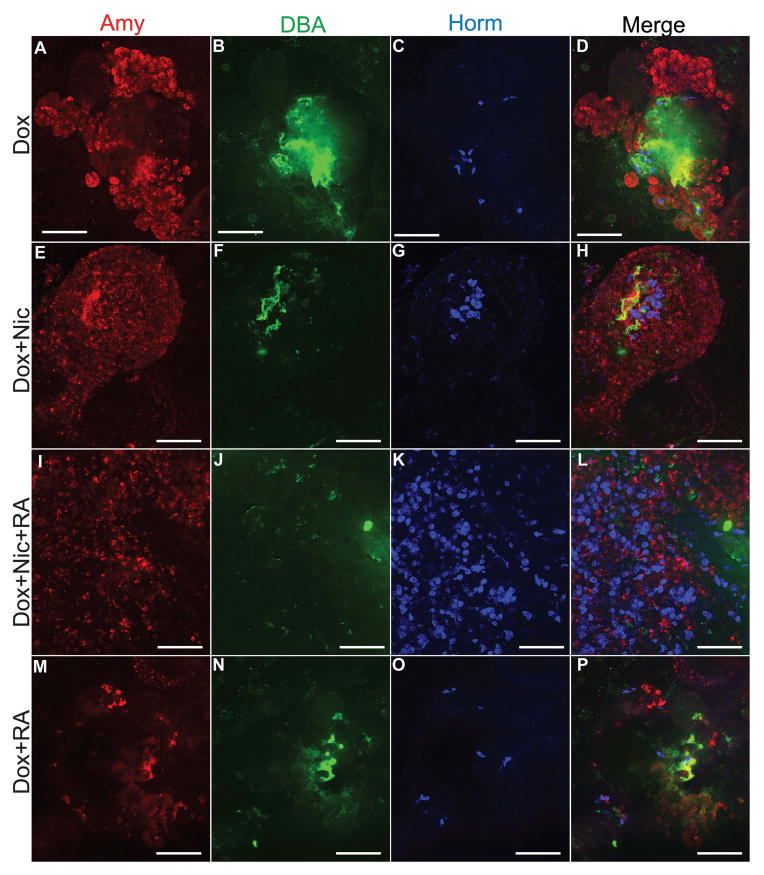
Besides its role in exocrine differentiation, pancreas-specific transcription factor 1a (PTF1a) is required for pancreas specification from the foregut endoderm and ultimately for endocrine cell formation. Examining the early role of PTF1a in pancreas development has been challenging due to limiting amounts of embryonic tissue material for study. Embryonic stem cells (ESCs) which can be differentiated in vitro, and without limit to the amount of experimental material, can serve as a model system to study these early developmental events. To this end, we derived and characterized a mouse ESC line with tetracycline-inducible expression of PTF1a (tet-Ptf1a mESCs). We found that transient ectopic expression of PTF1a initiated the pancreatic program in differentiating ESCs causing cells to activate PDX1 expression in bud-like structures resembling pancreatic primordia in vivo. These bud-like structures also expressed progenitor markers characteristic of a developing pancreatic epithelium. The epithelium differentiated to generate a wave of NGN3+ endocrine progenitors, and further formed cells of all three pancreatic lineages. Notably, the insulin+ cells in the cultures were monohormonal, and expressed PDX1 and NKX6.1. PTF1a-induced cultures differentiated into significantly more endocrine and exocrine cells and the ratio of endocrine-to-exocrine cell differentiation could be regulated by retinoic acid (RA) and nicotinamide (Nic) signaling. Moreover, induced cultures treated with RA and Nic exhibited a modest glucose response. Thus, this tet-Ptf1a ESC-based in vitro system is a valuable new tool for interrogating the role of PTF1a in pancreas development and in directing differentiation of ESCs to endocrine cells.

Keywords: Acinar morphology; Beta cells; Embryonic stem cells; Endocrine; Insulin; Neurogenin3; Pancreas development; Pancreatic duodenal homeobox 1; Pluripotent stem cells; Ptf1a.


Conflict of interest statement

The authors declare no conflict of interest directly related to the subject matter of the manuscript.

Figures

Fig. 1
Fig. 1
Generation and validation of a tetracycline inducible PTF1a mESC cell line. (A) Immunofluorescent staining for PTF1a and DAPI in tet-Ptf1a ESCs induced with Dox for 3 days (upper panel) or untreated (lower panel). Most of the induced cells express PTf1a while in the absence of Dox very few cells express PTf1a. Scale bars, 100μm. (B) Western blot of whole cell protein extracts obtained from tet-Ptf1a ESCs induced with Dox for 3 days or untreated cultures, probed for PTF1a and GAPDH shows induction of PTF1a protein upon addition of Dox. (C and D) tet-Ptf1a cells were cultured as embryoid bodies (EBs) for seven days and subsequently grown in attachment culture for 28 days. Various Dox induction schemes were tested including addition for 3 days post-plating between EB7+4 to EB 7+7 (Dox EB7+4-EB7+7), 7 days post-plating between EB7+0 to EB7+7 (Dox EB7+0-EB7+7), 28 days days post-plating between EB7+0 to EB7+28 (Dox EB7+0-EB7+28) or during 7 days of EB formation (Dox EB0-EB7). Negative controls were the parental cell line Ainv15 and untreated tet-Ptf1a cultures. Cultures were grown for 28 days post-plating and analyzed for transcripts of (C) endocrine hormones such as insulin (INS), glucagon (GLU) and somatostatin (SOM), and (D) the exocrine enzyme amylase (AMY). Cultures with 3 day Dox induction between EB7+4-EB7+7 had significantly higher insulin and lower amylase when compared to other treatment groups. Error bars indicate s.e. *P<0.05, **P<0.01 determined by ANOVA with Tukey’s multiple comparison test. n=3.
Fig. 2
Fig. 2
Dox-induced expression of Ptf1a in tet-Ptf1a ESC differentiation cultures activates expression of Pdx1. Tet-Ptf1a cells were differentiated in adherent EB-based cultures and treated with Dox from EB7+4 to EB7+7as shown in Fig. 1 and grown to indicated time points and analyzed. (A) Gene expression profile of Ptf1a and Pdx1 in Dox-treated and untreated cultures relative to undifferentiated tet-Ptf1a ESCs. (B) Western blot of whole cell protein extracts taken from induced tet-Ptf1a and Ainv15 probed with α-ptf1a and α-gapdh. (C–F) Tet-Ptf1a cells expressed PDX1 (red) when induced with Dox in the context of EB-based cultures (D), but not in undifferentiated cells (C). Untreated ESCs and EB-based cultures did not express PTF1a (green) or PDX1 (E,F). Scale bars, 100μm. (G) Sample histograms from flow cytometry on EB7+14 populations of Dox-treated and untreated tet-Ptf1a and Ainv15. (H) FACS analysis revealed that induced cultures have more PDX1+ cells than uninduced cultures, which gradually decreases over time as cells progressively differentiate. All data were normalized to values for Dox-treated tet-Ptf1a cells grown to EB7+14. Error bars indicate s.e. *P<0.05, ****P<0.0001 determined by 2-way ANOVA with Tukey’s multiple comparison test. n=3.
Fig. 3
Fig. 3
Time course analysis of PTF1a-PDX1 co-expression in tet-Ptf1a cultures induced with Dox from EB7+4 to EB7+7 reveals distinctive bud-like outgrowths and expression of PDX1. (A) Before treatment with Dox, at EB7+4, neither PTF1a nor PDX1 are expressed. (B,D,F) PTF1a over-expression leads to progressive increase in PDX1+ branched epithelium. At EB7+7, simple PDX1+ clusters are seen (B). Within 3 days, PDX1+ bud-like structures have grown, and undergone branching into PDX1+ PTF1a+ epithelium (D), eventually expanding and branching extensively (F), similar to that observed during pancreatic development in vivo. Insets show magnified regions to show co-expression. These bud-like outgrowths are not observed in cultures that have not been treated with Dox (C,E,G). A few scattered PDX1+ cells without distinct epithelial morphology can be seen in E, lower right corner. Scale bars, 100μm. (H) Quantification of small (< 200 cells) and large (≥ 200 cells) Ptf1a+Pdx1+ Bud-like outgrowths at various time points in induced vs. uninduced cultures. Error bars indicate s.e. *P<0.05,**P<0.01, ***P<0.001 determined by 2-way ANOVA with Bonferroni’s multiple comparison test to Dox EB7+7. n=3.
Fig. 4
Fig. 4
Ptf1a-induced cultures express characteristic markers of developing pancreatic epithelium, especially a wave of transient Neurogenin3. (A) Majority of the PDX1+ cells in the EB7+14 bud-like structures express SOX9 with the exception of some cells at budding tip regions. (B) NKX6.1 is predominantly restricted to PDX1+ cells at core of the bud-like structures and never at the periphery or tip. Insets show magnified regions. (C) Time course analysis of Ngn3 transcript levels in Dox-treated and untreated cultures relative to undifferentiated tet-Ptf1a ESCs shows that Ptf1a expression increased Ngn3 expression in ESC cultures. Error bars indicate s.e. **P<0.01, ****P<0.0001 determined by 2-way ANOVA with Dunnet’s multiple comparison test to No Dox tet-Ptf1a EB7+7. n=3–4. (D–F) A wave of NGN3 protein expression occurs in induced cultures peaking at EB7+16 (E vs. D, F) and corresponds with relative mRNA levels. There are still detectable numbers of Ngn3+ cells at EB7+14 and EB7+18 (D,F). Ngn3 appears to be primarily expressed in interior/trunk regions of branching structures and in low Pdx1 expressing cells as indicated in the insets. Scale bars, 100μm.
Fig. 5
Fig. 5
Pancreatic progenitors in induced cultures can further differentiate into all the three pancreatic lineages. Cultures were grown to EB7+28 and analyzed. (A) Acinar cells as indicated by Amylase expression (A) are arranged in typical lobular acinar-like structures, with DBA-staining duct cells (B) present amongst the lobules. Arrows show DBA staining. (C) Hormone+ cells (antibody cocktail against insulin, somatostatin and glucagon) are scattered between the acinar lobules. On further characterizing individual islet cell types, insulin+ cells expressed nuclear PDX1 (E) and co-expressed C-peptide (F). Abundant somatostatin+ cells co-expressing PDX1 were present (G). Nuclear PDX1 expression in somatostatin+ cells is indicated by arrowheads. Glucagon and insulin were not co-expressed (H). Scale bars, 100μm.
Fig. 6
Fig. 6
Treatment of Ptf1a-induced cultures with Nicotinamide (Nic) and Retinoic acid (RA) increases endocrine differentiation. (A) Schematic representation of the differentiation protocol. After induction of Ptf1a, cultures were treated with Retinoic acid for 3 days (EB7+7 to EB7+10) and/or Nicotinamide for the remainder of the culture period (EB7+7 to EB7+28). (B) Transcript analyses show treatment with Nic and RA increases insulin, glucagon and somatostatin expression and decreases amylase expression, while treatment with Nic alone increases amylase expression. Gene expression was calculated relative to uninduced tet-Ptf1a cell cultures. Error bars indicate s.e. *P<0.05, **P<0.01, ***P<0.001, ****P<0.0001 determined by 2-way ANOVA with Tukey’s multiple comparison test. n=3. (C) Hormone+ cells were counted manually. Hormone cell expression increases significantly with growth factor treatments. a = P<0.05 over all other tested conditions, b = P<0.05 over No Dox controls and Dox treated cultures, c = P<0.05 over No Dox controls. The overall number of cells per coverslip in the different conditions was similar at ~ 2×10⁵ cells. (D) Insulin content in Nic and RA treated Ptf1a-induced cultures were significantly higher than uninduced cultures. Error bars indicate s.e. ***P=0.0007, determined by unpaired two-tailed t test with Welch’s correction. n=2–4. (E) Glucose stimulated insulin release assay on Nic and RA treated Ptf1a-induced cultures showed a significant difference in the amount of C-peptide released under conditions of low (3.3mM) and high (25mM) glucose (LG vs. HG) compared to uninduced cells. Error bars indicate s.e. *P<0.05, determined by 2-way ANOVA with Tukey’s multiple comparison test. n=3.
Fig. 7
Fig. 7
Immunofluorescence images showing changes in differentiation status with Nic and RA treatment. Cell cultures were examined at EB7+28. The acinar-like lobular morphology and DBA expression present in Dox only-treated cell cultures (A, B) are lost by the addition of Nic and/or RA (I, J). Ptf1a-induced cell cultures treated with both Nic and RA have more hormone+ cells compared to cells treated with Dox alone (C vs. K). Adding Nic alone did not increase hormone+ cells significantly (E, G). Treatment with RA alone did enhance differentiation into amylase+ or hormone+ cell types (M, O). Scale bars, 100μm.

Similar articles

Cited by

References

    1. Beres TM, Masui T, Swift GH, et al. PTF1 Is an Organ-Specific and Notch-Independent Basic Helix-Loop-Helix Complex Containing the Mammalian Suppressor of Hairless (RBP-J) or Its Paralogue, RBP-L. Molecular and Cellular Biology. 2006;26(1):117–130. - PMC - PubMed
    1. Krapp A, Knöfler M, Frutiger S, et al. The p48 DNA-binding subunit of transcription factor PTF1 is a new exocrine pancreas-specific basic helix-loop-helix protein. The EMBO journal. 1996;15(16):4317–4329. - PMC - PubMed
    1. Krapp A, Knöfler M, Ledermann B, et al. The bHLH protein PTF1-p48 is essential for the formation of the exocrine and the correct spatial organization of the endocrine pancreas. Genes & Development. 1998;12 (23):3752–3763. - PMC - PubMed
    1. Cockell M, Stevenson BJ, Strubin M, et al. Identification of a cell-specific DNA-binding activity that interacts with a transcriptional activator of genes expressed in the acinar pancreas. Molecular and Cellular Biology. 1989;9(6):2464–2476. - PMC - PubMed
    1. Kawaguchi Y, Cooper B, Gannon M, et al. The role of the transcriptional regulator Ptf1a in converting intestinal to pancreatic progenitors. Nat Genet. 2002;32(1):128–134. - PubMed

Publication types

MeSH terms