. 2014 Feb;13(2):304-19.
doi: 10.1128/EC.00269-13. Epub 2013 Dec 27.

The ancient small GTPase Rab21 functions in intermediate endocytic steps in trypanosomes

Affiliations

The ancient small GTPase Rab21 functions in intermediate endocytic steps in trypanosomes

Moazzam Ali et al. Eukaryot Cell. 2014 Feb.

Abstract

Endocytosis is an essential process in nearly all eukaryotic cells, including the African trypanosome Trypanosoma brucei. Endocytosis in these organisms is exclusively clathrin mediated, although several lineage-specific features indicate that precise mechanisms are distinct from those of higher eukaryotes. T. brucei Rab21 is a member of an ancient, pan-eukaryotic, endocytic Rab clade that is retained by trypanosomes. We show that T. brucei Rab21 (TbRab21) localizes to endosomes, partially colocalizing with TbRab5A, TbRab28, and TbVps23, the latter two being present at late endosomes. TbRab21 expression is essential for cellular proliferation, and its suppression results in a partial block in traffic to the lysosome. RNA interference (RNAi)-mediated knockdown of TbRab21 had no effect on TbRab5A expression or location but did result in decreased in trans expression of ESCRT (trypanosome endosomal sorting complex required for transport) components and TbRab28, while knockdown of ESCRT subunit TbVps23 resulted in decreased TbRab21 expression. These data suggest that TbRab21 acts downstream of TbRab5A and functions in intimate connection with the trypanosome ESCRT system.


Figures

FIG 1
FIG 1
TbRab21 localizes to endocytic regions in trypanosomes. (A) Abundance of TbRab21 mRNA in BSF and PCF cells estimated by qRT-PCR. Data shown represent averages of the results determined for two separate samples normalized to telomerase reverse transcriptase. (B) IFA images showing ectopic expression of TbRab21 fused at its N terminus with yellow fluorescent protein (YFP) or hemagglutinin (HA) tags in BSF cells and YFP in PCF cells. Images were obtained by capturing native YFP- and Alexa Fluor 568-conjugated secondary antibody fluorescence, while DNA was visualized using DAPI staining. (C) Production of the tagged protein verified by Western blot analysis, along with negative (-ve) controls for antibody specificity.
FIG 2
FIG 2
TbRab21 defines a new endosomal subcompartment. (A) BSF and PCF cells stably expressing TbRab21 tagged with N-terminal HA or YFP were costained with markers of the T. brucei endomembrane system. Cells were labeled with mouse monoclonal antibodies against the HA epitope tag in addition to antibodies against T. brucei clathrin heavy chain (TbCLH), TbRab5A, TbRab11, p67, and TbRabX2. For costaining with TbVps23 and TbRab28, BSF cells expressing YFP-TbRab21 were transfected with HA-TbVps23 and HA-TbRab28. Alexa Fluor-labeled secondary antibodies and YFP native fluorescence were used to visualize subcellular markers, while nuclear and kinetoplast DNA was visualized using DAPI. Percent colocalization is shown at the bottom right of each set of panels; see Table S1 in the supplemental material for complete data. (B) BSF cells expressing HA-tagged TbRab21 were subjected to a continuous pulse of fluorescein-conjugated ConA at 4, 12, and 37°C. (C) HA-TbRab21 fluorescence intensity colocalization with ConA. A total of 25 randomly selected cells from each sample were analyzed and the percentages of colocalization determined.
FIG 3
FIG 3
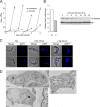
TbRab21 is required for correct cell cycle progression but does not affect flagellar pocket morphology. (A) Growth curve of BSF TbRab21 knockdown cells. RNAi cells were grown in the presence (broken lines) or absence (solid lines) of 1 μg/ml tetracycline (Tet) to induce transcription of dsRNA. Cell numbers were determined every 48 h (error bars represent the standard errors of duplicate inductions). (B) Validation of TbRab21 RNAi by qRT-PCR and Western blotting. (Left) RNA was extracted from uninduced and 24-h-induced cultures in duplicate, and qRT-PCR was performed in triplicate for each sample. (Right) Validation of knockdown by Western blotting. Copy numbers of overexpressed HA-tagged TbRab21 decreased specifically after the induction of TbRab21 RNAi. TbBiP is shown as a loading control. (C) Phase and DAPI images of cells at 18 and 24 h of induction. An uninduced (-Tet) cell is shown for comparison to the variation observed in induced cells (+Tet), with clear signs of failed cytokinesis. All images were captured at the same magnification. Bar, 5 μm. (D) Ultrastructure of TbRab21 knockdown BSF cells. (Clockwise from top left) Cells 12 h postinduction with normal flagellar pocket (FP) and nucleus (N); 18-h-induced cell showing normal morphology of Golgi complex (G) with cis- and trans-faces, ER exit site, and normal morphology of endoplasmic reticulum (ER); and cell 12 h postinduction showing an enlarged flagellar pocket (BigEye phenotype); a distinctive electron dense VSG layer (VSG) can be seen around the enlarged pocket. An inset of the FP membrane showing the electron-dense VSG coat is shown at center. Images were captured at various magnifications; all scale bars denote 500 nm.
FIG 4
FIG 4
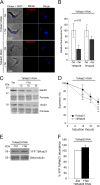
The morphology of most endomembrane compartments is not critically dependent on TbRab21 expression. (A) Immunofluorescence analysis of T. brucei endosomal components performed on TbRab21-depleted BSF cells. (B) Total protein levels of TbRab5A, TbRab11, and TbClathrin were quantified by Western blotting in TbRab21-depleted cells. The BSF RNAi TbRab21 cell line was induced and cell lysate prepared at different time intervals. TbBiP was used as the total protein loading control.
FIG 5
FIG 5
TbRab21 is required for maintaining expression of intermediate endosomal components. (A) Immunofluorescence analysis of HA-tagged TbRab28 and TbVps23 in TbRab21 knockdown cells. −Tet (uninduced control) and +Tet (18 h induced) cells were fixed and stained for the HA epitope tag using mouse anti-HA and Alexa Fluor 568 (red) antibodies, while DNA was counterstained using DAPI (blue). Images were captured under identical exposure conditions, and a reduction in the intensity of HA-TbRab28 and HA-TbVps23 associated with endosomes was observed after induction of RNAi against TbRab21. (B) Quantification of HA-TbRab28 and HA-TbVps23 fluorescence in cells from panel A. A total of 40 randomly selected cells from each sample were analyzed under nonsaturating conditions using Metamorph software. Results for induced cultures were normalized to uninduced controls set to 100%. Error bars represent standard errors of the means. (C and D) Following knockdown of TbRab21, total protein levels of HA-TbRab28 and HA-TbVps23 were quantified by Western blotting. Proteins were quantified using ImageJ by normalizing individual lanes to Ponceau S total protein loading controls. The average numbers of multiple inductions (n = 3 to 5) were plotted normalized to uninduced cells normalized to 100%. Error bars show standard errors of the means. (E and F) RNAi-mediated knockdown of TbRab28 was induced for 36 h followed by Western blotting to monitor levels of YFP TbRab21. Beta-tubulin was used as a loading control. Results for induced cultures were normalized to uninduced controls (100%). Error bars represent standard errors of the means. For each panel, the relevant RNAi target is shown above a bar.
FIG 6
FIG 6
TbRab21 is involved in surface protein turnover. (A) IFA of ISG65 and ISG75 in TbRab21 RNAi cells. −Tet (uninduced control) and 18 h +Tet (induced) cells were fixed and treated with 0.1% Triton X-100 to permeabilize cells and remove most of the surface ISGs. The internal, endosomal ISG pool was stained using polyclonal anti-ISG65 and ISG75 antibodies that were visualized using Alexa Fluor 568-labeled secondary antibodies. Images were captured under identical exposure conditions. Bar, 5 μm. (B) Total levels of ISG65 and ISG75 was quantified by Western blotting, following knockdown of TbRab21. (C) Levels of endosomal ISG65 and ISG75 were quantified in TbRab21 RNAi cells by IFA. A total of 30 randomly selected induced (18 h) and uninduced cells were analyzed under nonsaturating conditions using Metamorph software. Results showed significant increases in the endosomal pools of ISGs after TbRab21 depletion, whereas total ISG levels remained unchanged.
FIG 7
FIG 7
TbRab21 is required for normal concanavalin A trafficking to the lysosome. (A) Endocytic ability of BSF TbRab21 RNAi cells was analyzed by incubating induced (I) and uninduced (UI) cells with fluorescein-conjugated ConA at 37°C. The uptake of ConA was analyzed on a Cyan ADP fluorescence-activated cell sorter (FACS) analyzer. Only 1N1K cells were included in the analysis (gating based on Hoechst staining). Approximately 50,000 cells were counted for each sample, and the median fluorescence of ConA was plotted against time of uptake, with error bars showing standard errors of the medians. Results from a representative of multiple independent inductions are shown. (B) IFA images of BSF TbRab21 RNAi cells showing localization of ConA and lysosomal marker p67. Uninduced (-Tet) and 18 h induced (+Tet) cells received a 15-min continuous pulse of fluorescein-conjugated ConA (green) at 37°C. Cells were fixed and costained with mouse anti-p67. (C) The percentages of ConA fluorescence intensity colocalized with p67 fluorescence were calculated using an ImageJ plug-in for colocalization analysis. A total of 30 randomly selected cells (excluding those morphologically defective) from each sample of induced and uninduced cells were subjected to analysis, and percent colocalization was plotted, with error bars representing standard errors of the means. The experiment was repeated on two independent inductions, and Student's t test showed a statistically significant difference between induced and uninduced cells for each induction.
FIG 8
FIG 8
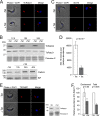
Membrane recruitment of TbRab21 is independent of TbRab5A but depends on TbVps23. (A) BSF TbRab5A knockdown cells were transfected with HA-TbRab21 and induced for 36 h to deplete TbRab5A. Cells were fixed and labeled with monoclonal anti-HA antibodies followed by anti-mouse Alexa Fluor 568-labeled antibodies. DNA was counterstained using DAPI. (B) Western blots showing HA-TbRab21 and TbClathrin, following knockdown of TbRab5A. (C) IFA of the internal pool of ISG75 in TbRab5A RNAi cells. (D) Level of endosomal ISG75 quantified in TbRab5A RNAi cells by IFA. A total of 30 randomly selected induced and uninduced cells were counted under nonsaturating conditions using Metamorph software. (E) TbVps23 knockdown cells expressing recombinant HA-Rab21 and IFA of induced and uninduced cells. (Inset) Total amount of HA-tagged TbRab21 quantified by Western blotting, following knockdown of TbVps23. (F) Quantification of endosomal TbRab21 by IFA and total TbRab21 by Western blotting after 24 h of TbVps23 RNAi treatment. IFA quantification was done by randomly selecting 30 cells each from −Tet (white bars) and +Tet (gray bars) cells and determining HA-Rab21-related fluorescence using Metamorph. +Tet data are expressed as percent −Tet, whereas the error bars denote standard errors of the means. The total quantity of HA-TbRab21 in +Tet cells is plotted as percent −Tet. Student's t test showed statistically significant differences in the levels of expression of HA-tagged TbRab21 after TbVps23 knockdown.
FIG 9
FIG 9
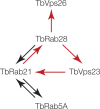
A model linking endosomal Rabs and components of ESCRT and retromer in trypanosomes. Relationships are predicted based on the in trans effect on protein copy number following RNA interference. Data represent induction of RNAi against mRNA encoding protein A and assessment of copy numbers of protein B. Arrows indicate the interactions where analysis has been performed, with the arrow pointing from protein A to protein B, and red indicates that the RNAi resulted in decreased copy numbers. Data suggest a complex interplay between TbRab21 and TbRab28 and between ESCRT and retromer but suggest that the network does not extend to the early endocytic TbRab5A. No direct interactions between the proteins mentioned above have currently been demonstrated, and it is unknown how these genetic interactions are mediated at the physical level.

Similar articles

Cited by

References

    1. Field MC, Carrington M. 2009. The trypanosome flagellar pocket. Nat. Rev. Microbiol. 7:775–786. 10.1038/nrmicro2221 - DOI - PubMed
    1. Allen CL, Goulding D, Field MC. 2003. Clathrin-mediated endocytosis is essential in Trypanosoma brucei. EMBO J. 22:4991–5002. 10.1093/emboj/cdg481 - DOI - PMC - PubMed
    1. Manna P, Kelly S, Field MC. 2013. Co-evolution of antigenic variation and adaptins in trypanosomatids. Mol. Protein Evol. 67:123–128 - PMC - PubMed
    1. Adung'a VO, Gadelha C, Field MC. 2013. Proteomic analysis of clathrin interactions in trypanosomes reveals dynamic evolution of endocytosis. Traffic 14:440–457. 10.1111/tra.12040 - DOI - PubMed
    1. Engstler M, Pfohl T, Herminghaus S, Boshart M, Wiegertjes G, Heddergott N, Overath P. 2007. Hydrodynamic flow-mediated protein sorting on the cell surface of trypanosomes. Cell 131:505–515. 10.1016/j.cell.2007.08.046 - DOI - PubMed

Publication types

MeSH terms

LinkOut - more resources