

Histopathological image analysis for centroblasts classification through dimensionality reduction approaches
- PMID: 24376080
- PMCID: PMC4017952
- DOI: 10.1002/cyto.a.22432
Histopathological image analysis for centroblasts classification through dimensionality reduction approaches
Abstract
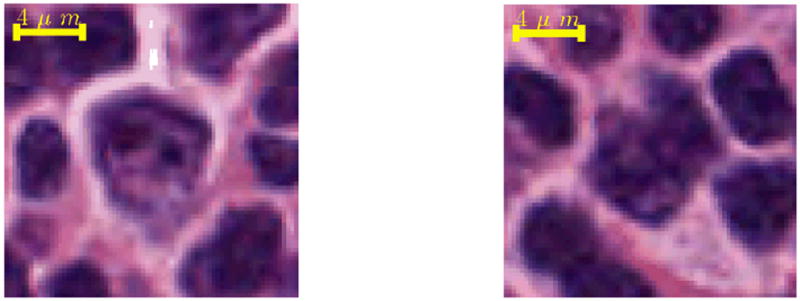
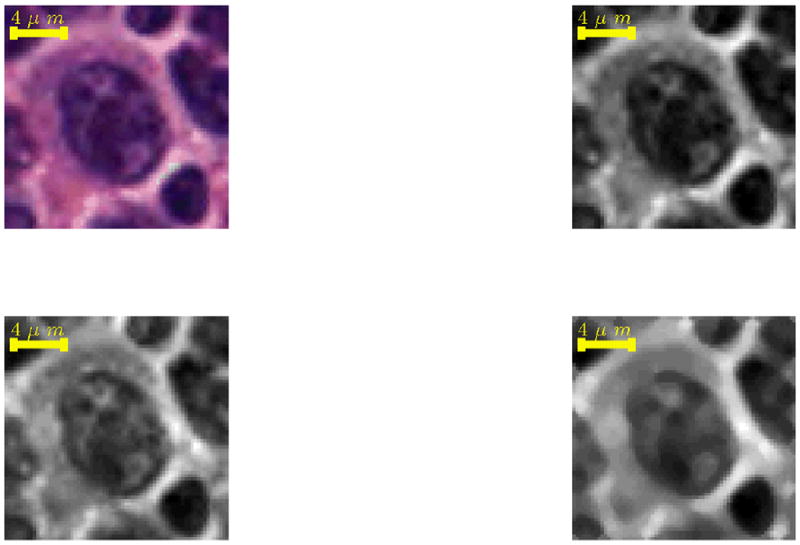
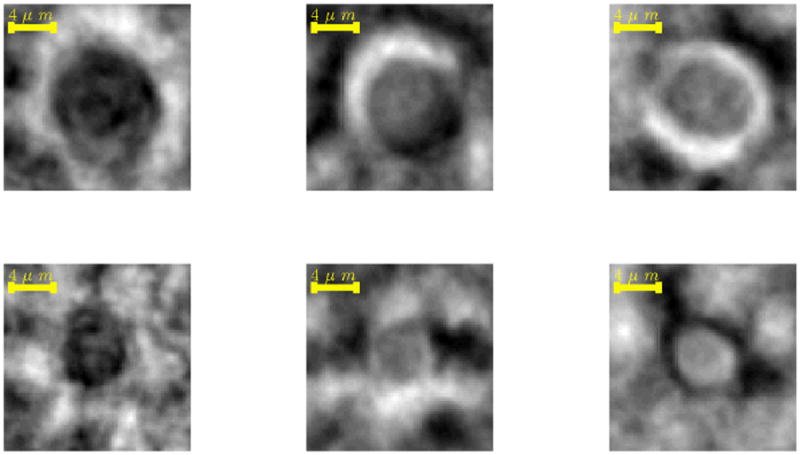
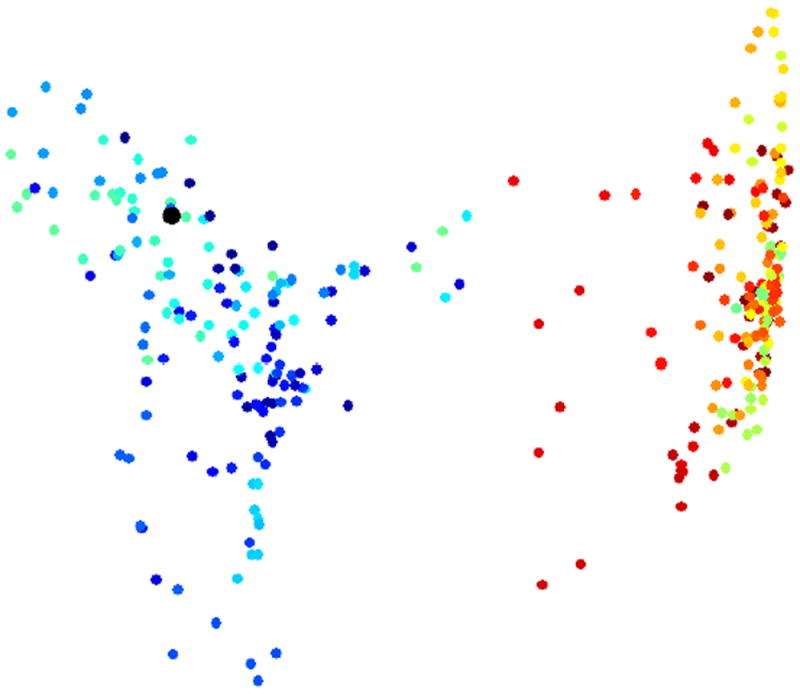
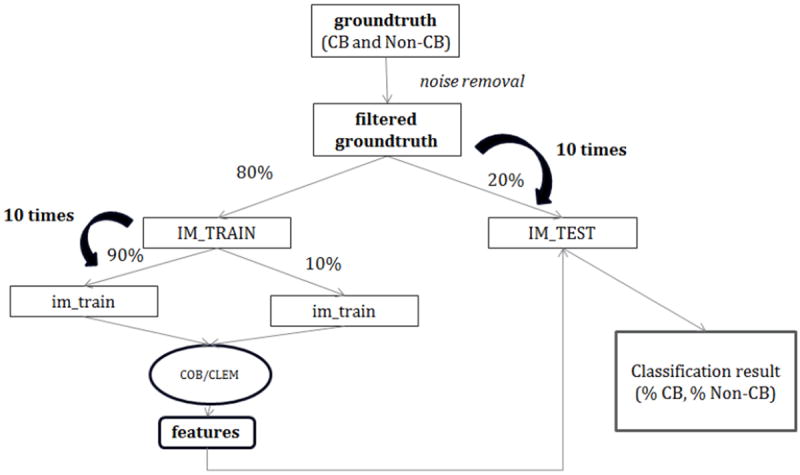
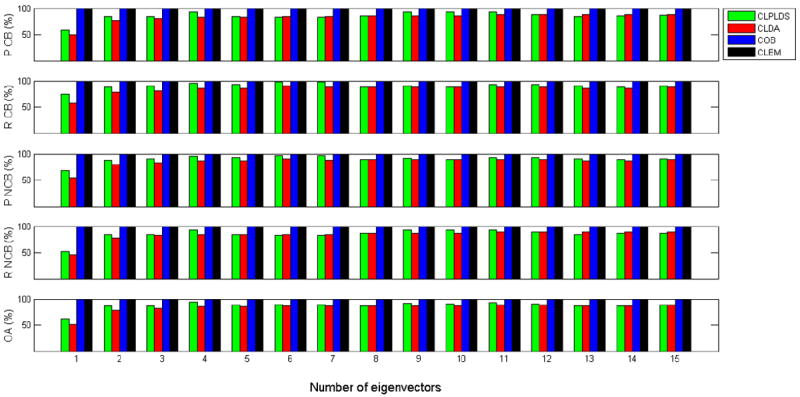
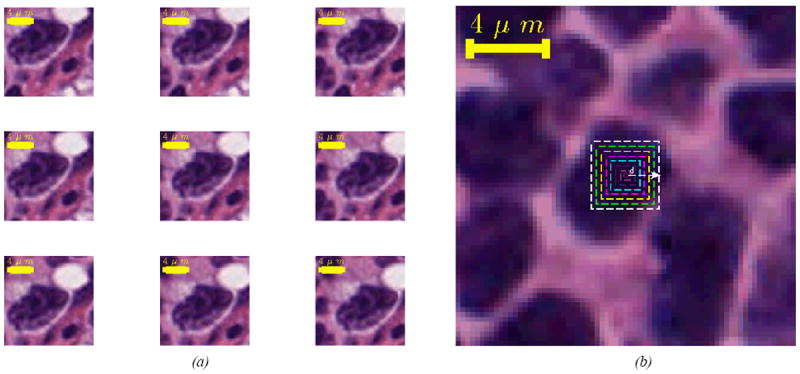
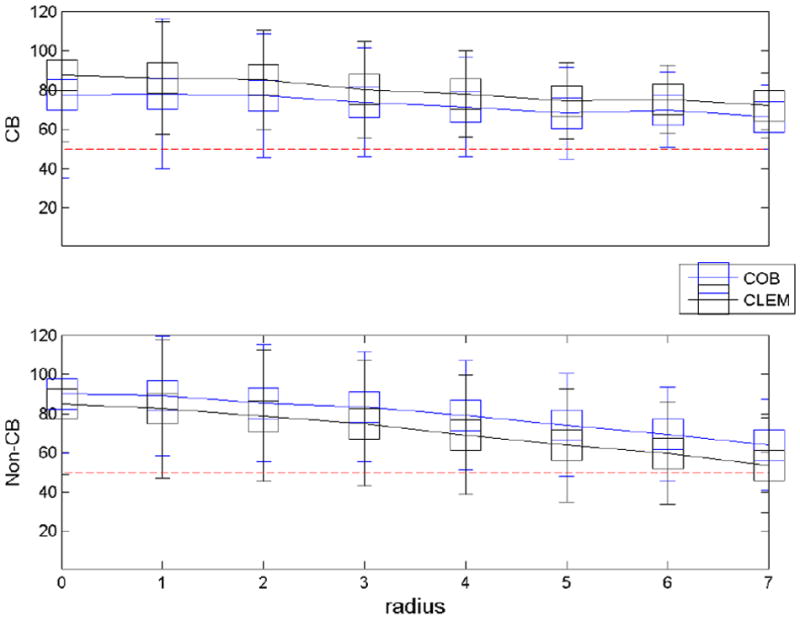
We present two novel automated image analysis methods to differentiate centroblast (CB) cells from noncentroblast (non-CB) cells in digital images of H&E-stained tissues of follicular lymphoma. CB cells are often confused by similar looking cells within the tissue, therefore a system to help their classification is necessary. Our methods extract the discriminatory features of cells by approximating the intrinsic dimensionality from the subspace spanned by CB and non-CB cells. In the first method, discriminatory features are approximated with the help of singular value decomposition (SVD), whereas in the second method they are extracted using Laplacian Eigenmaps. Five hundred high-power field images were extracted from 17 slides, which are then used to compose a database of 213 CB and 234 non-CB region of interest images. The recall, precision, and overall accuracy rates of the developed methods were measured and compared with existing classification methods. Moreover, the reproducibility of both classification methods was also examined. The average values of the overall accuracy were 99.22% ± 0.75% and 99.07% ± 1.53% for COB and CLEM, respectively. The experimental results demonstrate that both proposed methods provide better classification accuracy of CB/non-CB in comparison with the state of the art methods.
Keywords: LDA; Laplacian Eigenmaps; SVD; dimensionality reduction; follicular lymphoma; intrinsic dimensionality.
© 2013 International Society for Advancement of Cytometry.
Figures
References
-
- Swerdlow SH, Campo E, Harris NL, Jaffe ES, Pileri SA, Stein H, Thiele J, Vardiman JW. WHO Classification of Tumours of Haemaopoietic and Lymphoid Tissues. Fourth Edition. Lyon: World Health Organization; 2008. p. 439.
-
- Jaffe ES, Harris NL, Stein H, Vardiman JW. World Health Organization Classification of Tumours: Pathology and Genetics of Tumours of Haematopoietic and Lymphoid Tissues. Annals of Oncology. 2001;3(3):490–491.
-
- Fu WJ. Penalized Regressions: The Bridge Versus the Lasso. Journal of Computational and Graphical Statistics. 1998;7(3):397–416.
-
- Metter GE, Nathwani BN, Burke JS, Winberg CD, Mann RB, Barcos M, Kjeldsberg CR, Whitcomb CC, Dixon DO, Miller TP. Morphological sub-classification of follicular lymphoma: Variability of diagnoses among hematopathologists, a collaborative study between the repository center and pathology panel for lymphoma clinical studies. Journal of Clinical Oncology. 1985;3:25–38. - PubMed
-
- Dick F, VanLier S, Banks P, Frizzera G, Witrak G, Gibson R, Everett G, Schuman L, Isacson P, O’Conor G, Cantor K, Blattner W, Blair Aaron. Use of the working formulation for non-Hodgkin’s lymphoma in epidemiological studies: Agreement between reported diagnoses and a panel of experienced pathologists. Journal of National Cancer Institute. 1987;78:1137–1144. - PubMed
Publication types
MeSH terms
Grants and funding
LinkOut - more resources
Full Text Sources
Other Literature Sources
