. 2014 Feb 1;192(3):919-28.
doi: 10.4049/jimmunol.1301979. Epub 2013 Dec 27.

B cell-specific loss of Lyn kinase leads to autoimmunity

Affiliations

B cell-specific loss of Lyn kinase leads to autoimmunity

Chrystelle Lamagna et al. J Immunol. .

Abstract

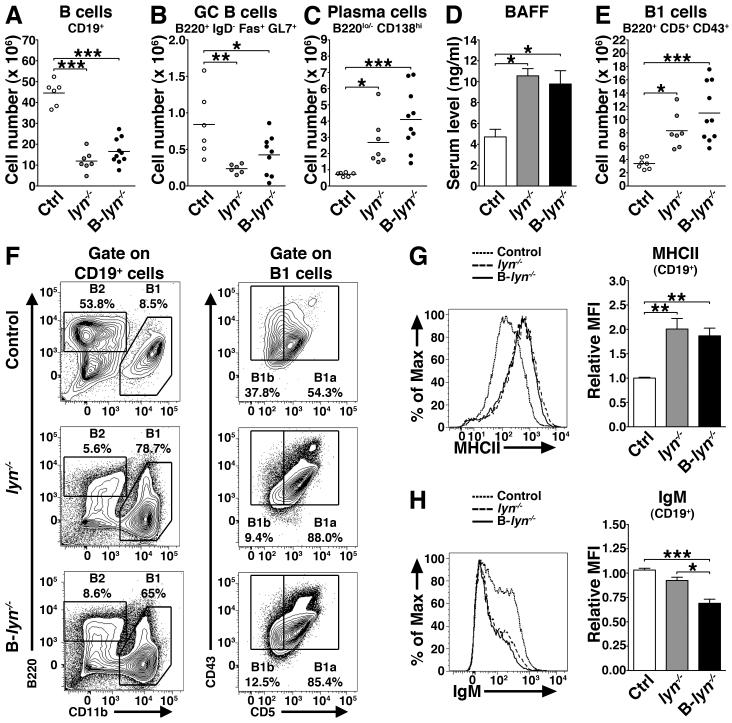
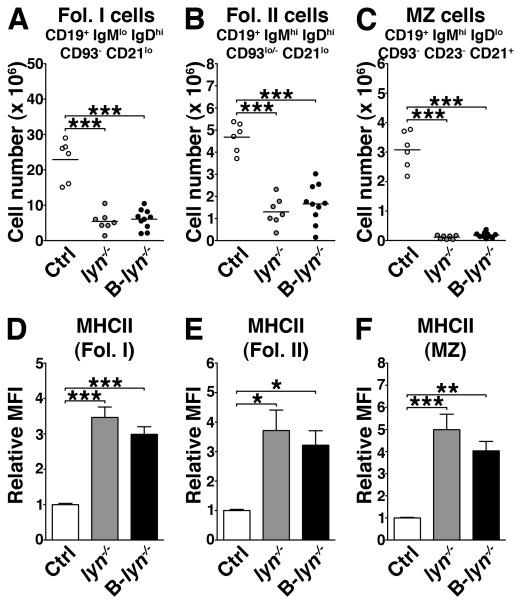
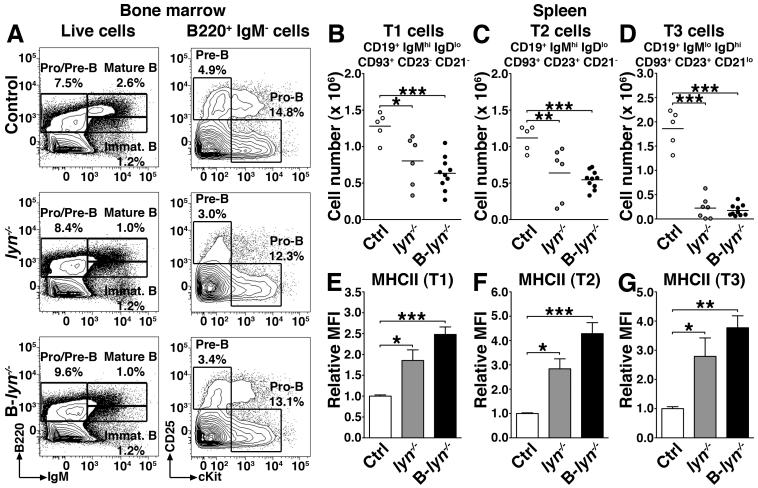
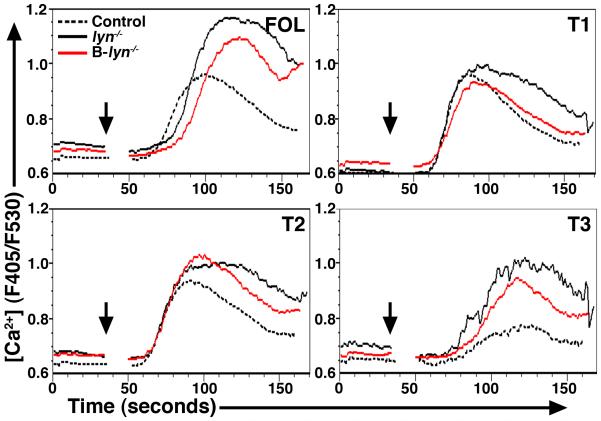
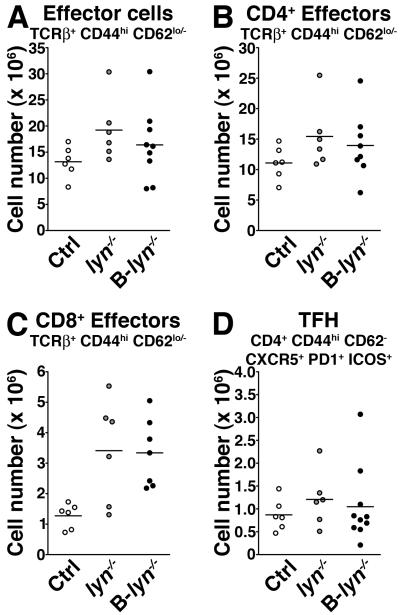
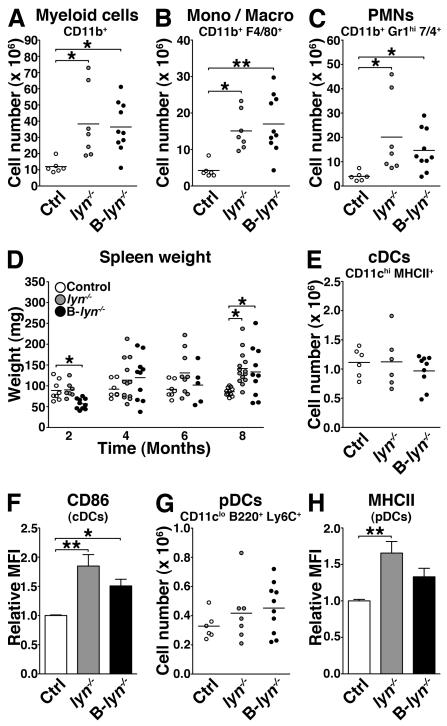
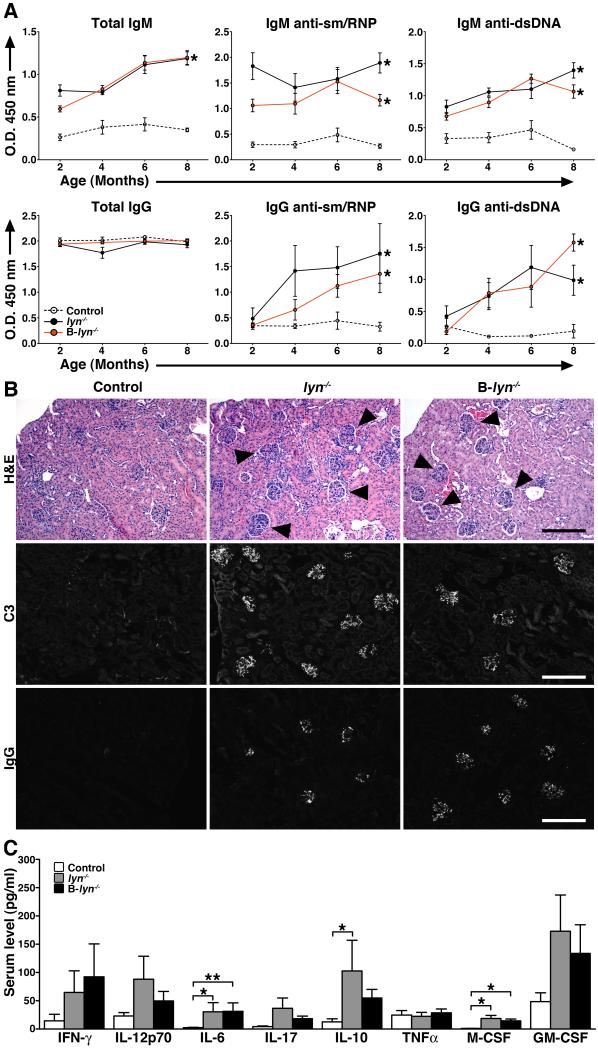
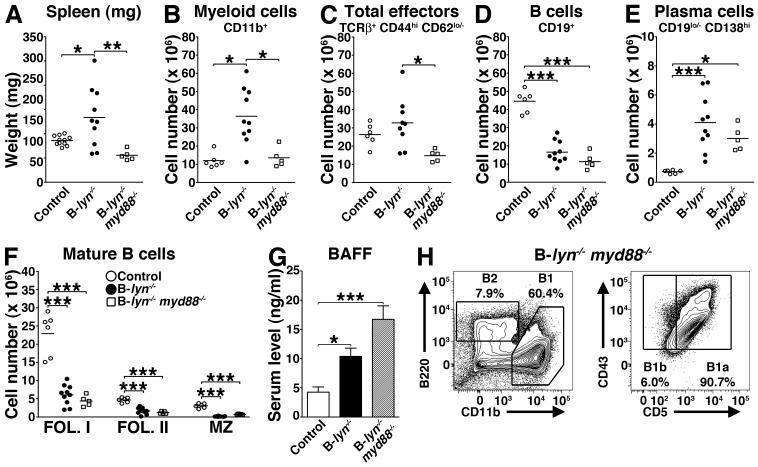
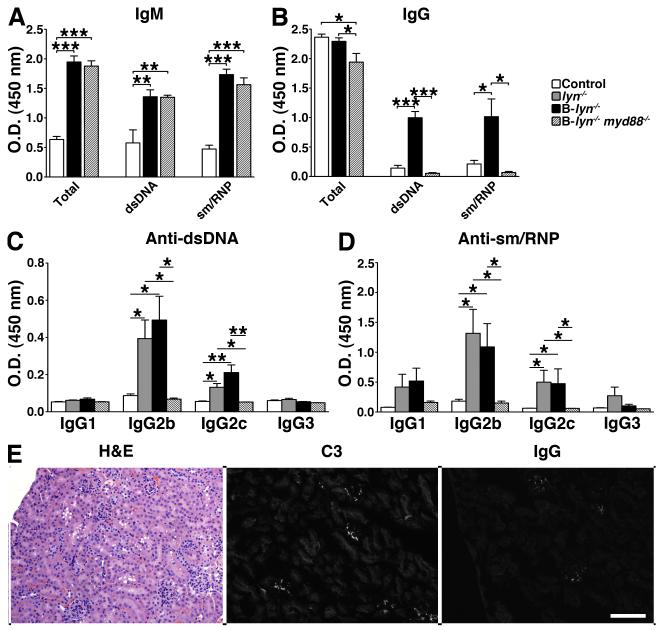
The Lyn tyrosine kinase regulates inhibitory signaling in B and myeloid cells: loss of Lyn results in a lupus-like autoimmune disease with hyperactive B cells and myeloproliferation. We have characterized the relative contribution of Lyn-regulated signaling pathways in B cells specifically to the development of autoimmunity by crossing the novel lyn(flox/flox) animals with mice carrying the Cre recombinase under the control of the Cd79a promoter, resulting in deletion of Lyn in B cells. The specific deletion of Lyn in B cells is sufficient for the development of immune complex-mediated glomerulonephritis. The B cell-specific Lyn-deficient mice have no defects in early bone marrow B cell development but have reduced numbers of mature B cells with poor germinal centers, as well as increased numbers of plasma and B1a cells, similar to the lyn(-/-) animals. Within 8 mo of life, B cell-specific Lyn mutant mice develop high titers of IgG anti-Smith Ag ribonucleoprotein and anti-dsDNA autoantibodies, which deposit in their kidneys, resulting in glomerulonephritis. B cell-specific Lyn mutant mice also develop myeloproliferation, similar to the lyn(-/-) animals. The additional deletion of MyD88 in B cells, achieved by crossing lyn(flox/flox)Cd79a-cre mice with myd88(flox/flox) animals, reversed the autoimmune phenotype observed in B cell-specific Lyn-deficient mice by blocking production of class-switched pathogenic IgG autoantibodies. Our results demonstrate that B cell-intrinsic Lyn-dependent signaling pathways regulate B cell homeostasis and activation, which in concert with B cell-specific MyD88 signaling pathways can drive the development of autoimmune disease.


Figures

Figure 1
Figure 1. Lyn inhibitory signal in B cells controls B cell homeostasis
(A-C) Absolute numbers of total B cells (A), GC B cells (B) and plasma cells (C) in the spleens of 8 month-old control, lyn−/− and B-lyn−/− mice. Data represent mean of independent experiments. Each dot represents an individual mouse. (D) BAFF levels in the serum of control, lyn−/− and B-lyn−/− mice (8 month-old) were determined by ELISA. Bars represent mean ± SEM from 6 – 10 mice per group. (E) Absolute numbers of B1 cells in the spleens of 8 month-old control, lyn−/− and B-lyn−/− mice. Data represent mean of independent experiments. Each dot represents an individual mouse. (F) Representative FACS contours showing the percentages of B1 and B2 cells in the peritoneal cavity of 8 month-old control, lyn−/− and B-lyn−/− mice. B1 cells were determined as CD19+ CD11b+ B220lo/− CD43+ cells and further defined as B1a (CD5+) or B1b (CD5) subsets. B2 cells were determined as CD19+ B220+ CD11b cells. (G) Representative FACS histogram showing the expression level of MHCII by splenic B cells from 8 month-old mice (left panel). MFI (Relative to control) of MHCII expressed by B cells in the spleens of 8 month-old mice (right panel). Bars represent mean ± SEM of independent experiments from 6-10 mice per group. (H) Representative FACS histogram showing the expression level of IgM by splenic B cells from 8 month-old mice (left panel). MFI (relative to control) of IgM expressed by B cells in the spleens of 8 month-old mice (right panel). Bars represent mean ± SEM of independent experiments from 6-10 mice per group. (A-H) * P ≤ 0.05, ** P ≤ 0.01, *** P ≤ 0.001 (One-way ANOVA).
Figure 2
Figure 2. Lyn is required for the development of mature B cells
(A-C) Absolute numbers of follicular I (Fol. I, A), follicular II (Fol. II, B) and marginal zone (MZ) B cells (C) in the spleens of 8 month-old control, lyn−/− and B-lyn−/− mice. Data represent mean of independent experiments. Each dot represents an individual mouse. (D-F) MFI (relative to control) of MHCII expressed by Fol. I (D), Fol. II (E) and MZ (F) B cells in the spleens of 8 month-old mice. Bars represent mean ± SEM of independent experiments from 6-10 mice per group. (A-F) * P ≤ 0.05, ** P ≤ 0.01, *** P ≤ 0.001 (One-way ANOVA).
Figure 3
Figure 3. B cell intrinsic loss of Lyn leads to reduction in splenic T1, T2 and T3 cells
(A) Representative contour plots showing the percentages of Pro/Pre-B and mature/immature B cells in the bone marrow of 2 month-old control, lyn−/− and B-lyn−/− mice. (B-D) Absolute numbers of transitional T1 (B), T2 (C) and T3 (D) B cells in the spleens of 2 month-old control, lyn−/− and B-lyn−/− mice. Data represent mean of independent experiments. Each dot represents an individual mouse. (E-G) MFI (relative to control) of MHCII expressed by transitional T1 (E), T2 (F) and T3 (G) B cells in the spleens of 2 month-old mice. Bars represent mean ± SEM of independent experiments from 5-10 mice per group. (B-G) * P ≤ 0.05, ** P ≤ 0.01, *** P ≤ 0.001 (One-way ANOVA).
Figure 4
Figure 4. Lyn signal in follicular and T3 B cells restrains calcium signaling upon BCR engagement
Calcium release in control, lyn−/− and B-lyn−/− T1, T2, T3 and follicular splenic B cells after stimulation with 15 μg/ml anti-IgM F(ab’)2. Histograms show median intracellular Ca2+ concentration as measured by fluorescence ratio (F405/F530). Data are representative of three independent experiments.
Figure 5
Figure 5. Selective deletion of Lyn in B cells leads to mild T cell activation
Absolute numbers of total (A), CD4+ (B), CD8+ (C) effector and T follicular helper cells (D) in the spleens of 8 month-old control, lyn−/− and B-lyn−/− mice. Data represent mean of independent experiments. Each dot represents an individual mouse. (A-D) Not statistically significant (One-way ANOVA).
Figure 6
Figure 6. Specific deletion of Lyn in B cells leads to myeloproliferative phenotype comparable to lyn−/−
(A-C) Absolute numbers of total myeloid cells (A), monocytes/macrophages (B) and granulocytes (C) in the spleens of 8 month-old control, lyn−/− and B-lyn−/− mice. (D) Weights of spleens harvested from control, lyn−/− and B-lyn−/− mice were recorded at 2, 4, 6 and 8 months of age. (E) Absolute numbers of conventional DCs in the spleens of 8 month-old control, lyn−/− and B-lyn−/− mice. (F) MFI (relative to control) of CD86 expressed by conventional DCs in the spleens of 8 month-old mice. Bars represent mean ± SEM of independent experiments from 6-10 mice per group. (G) Absolute numbers of plasmacytoid DCs in the spleens of 8 month-old control, lyn−/− and B-lyn−/− mice. (H) MFI (relative to control) of MHCII expressed by plasmacytoid DCs in the spleens of 8 month-old mice. Bars represent mean ± SEM of independent experiments from 6-10 mice per group. (A-E, G) Data represent mean of independent experiments. Each dot represents an individual mouse. (A-H) * P ≤ 0.05, ** P ≤ 0.01 (One-way ANOVA).
Figure 7
Figure 7. Specific deletion of Lyn in B cells is sufficient for the development of lupus-like autoimmunity but not inflammatory disease
(A) Detection of autoreactive IgM- (upper panel) and IgG-isotype (lower panel) antibodies in the serum of 2-, 4-, 6- and 8- month-old control, lyn−/− and B-lyn−/− mice. Data represent mean ± SEM from 6 – 10 mice per group. (B) H&E, C3 and IgG staining of kidney sections from 8 month-old control, lyn−/− and B-lyn−/−mice. Arrowheads indicate enlarged glomeruli. Representative pictures are shown. Scale bars represent 50 μm. (C) Serum cytokine levels comparing control, lyn−/− and B-lyn−/− mice (6-8 month-old) were determined by Luminex assay. Bars represent mean ± SEM from 6 – 14 mice per group. (A and C), * P ≤ 0.05, ** P ≤ 0.01, ** P ≤ 0.001 (One-way ANOVA).
Figure 8
Figure 8. Deletion of MyD88 in Lyn-deficient B cells rescues the myeloproliferative phenotype but not the defect in B cell homeostasis observed in Lyn-deficient B cells
(A) Weights of spleens harvested from 8 month-old control, B-lyn−/− and B-lyn−/− myd88−/− mice. (B-F) Absolute numbers of myeloid (B), total effector (C), B (D), plasma (E) and mature B cells (F) in the spleens of 8 month-old control, B-lyn−/− and B-lyn−/− myd88−/− mice. (A-F) Data from control and B-lyn−/− groups are the same as represented in Figs. 1, 2, 6 and 7 to perform comparisons to the B-lyn−/− myd88−/− mice. Data represent mean of independent experiments. Each dot represents an individual mouse. * P ≤ 0.05, ** P ≤ 0.01, ** P ≤ 0.001 (One-way ANOVA). (G) BAFF levels in the serum of control, B-lyn−/− and B-lyn−/− myd88−/− mice (8 month-old) were determined by ELISA. Bars represent mean ± SEM from 6 – 10 mice per group. (H) Representative FACS contours showing the percentages of B1 and B2 cells in the peritoneal cavity of 8 month-old B-lyn−/− myd88−/− mice. B1 cells were determined as CD19+ CD11b+ B220lo/− CD43+ cells and further defined as B1a (CD5+) or B1b (CD5) subsets. B2 cells were determined as CD19+ B220+ CD11b cells.
Figure 9
Figure 9. Specific deletion of Lyn and MyD88 in B cells prevents the development of pathogenic class-switched autoantibodies and autoimmunity
(A-D) Detection of autoreactive IgM-isotype (A), IgG-isotype (B) and pathogenic class-switched IgG anti-dsDNA (C) or anti-sm/RNP (D) antibodies in the serum of 8- month-old control, B-lyn−/− and B-lyn−/− myd88−/− mice. Bars represent mean ± SEM from 6 mice per group. * P ≤ 0.05, ** P ≤ 0.01, ** P ≤ 0.001 (One-way ANOVA). (E) H&E, C3 and IgG staining of kidney sections from 8 month-old B-lyn−/− myd88−/− mice. Representative pictures are shown. Scale bars represent 50 μm.

Similar articles

Cited by

References

    1. Lowell CA. Src-family and Syk kinases in activating and inhibitory pathways in innate immune cells: signaling cross talk. Cold Spring Harb Perspect Biol. 2011;3 - PMC - PubMed
    1. Scapini P, Pereira S, Zhang H, Lowell CA. Multiple roles of Lyn kinase in myeloid cell signaling and function. Immunol Rev. 2009;228:23–40. - PMC - PubMed
    1. Saijo K, Schmedt C, Su IH, Karasuyama H, Lowell CA, Reth M, Adachi T, Patke A, Santana A, Tarakhovsky A. Essential role of Src-family protein tyrosine kinases in NF-kappaB activation during B cell development. Nature immunology. 2003;4:274–279. - PubMed
    1. Ohashi PS, DeFranco AL. Making and breaking tolerance. Curr Opin Immunol. 2002;14:744–759. - PubMed
    1. DeFranco AL, Chan VW, Lowell CA. Positive and negative roles of the tyrosine kinase Lyn in B cell function. Semin Immunol. 1998;10:299–307. - PubMed

Publication types

MeSH terms