Review
. 2013 Dec 11:4:439.
doi: 10.3389/fimmu.2013.00439.

Mathematical Models of the Impact of IL2 Modulation Therapies on T Cell Dynamics

Affiliations
Review

Mathematical Models of the Impact of IL2 Modulation Therapies on T Cell Dynamics

Kalet León et al. Front Immunol. .

Abstract

Several reports in the literature have drawn a complex picture of the effect of treatments aiming to modulate IL2 activity in vivo. They seem to promote either immunity or tolerance, probably depending on the specific context, dose, and timing of their application. Such complexity might derive from the pleiotropic role of IL2 in T cell dynamics. To theoretically address the latter possibility, our group has developed several mathematical models for Helper, Regulatory, and Memory T cell population dynamics, which account for most well-known facts concerning their relationship with IL2. We have simulated the effect of several types of therapies, including the injection of: IL2; antibodies anti-IL2; IL2/anti-IL2 immune-complexes; and mutant variants of IL2. We studied the qualitative and quantitative conditions of dose and timing for these treatments which allow them to potentiate either immunity or tolerance. Our results provide reasonable explanations for the existent pre-clinical and clinical data, predict some novel treatments, and further provide interesting practical guidelines to optimize the future application of these types of treatments.

Keywords: T cell dynamics; interleukin 2; interleukin 2 mutants; mathematical model; regulatory T cells.


Figures

Figure 1
Figure 1
Diagram of the processes occurring in the two compartments considered in the model. At the left side of the diagram the blood compartment is shown, where soluble molecules related with IL2 modulatory therapies are introduced and eliminated. This compartment is in constant molecular exchange with the lymph nodes (right side of the diagram). In this last class of compartment, occur the processes related with the dynamics of T cells and their interaction with the IL2 and other soluble molecules.
Figure 2
Figure 2
Diagrams of helper (E), regulatory (R), and memory (M) T-cell life cycle considered in the model. New resting E (EN) and R (RN) cells are constantly generated by the thymus. These resting T cells become activated by interaction with their cognate APCs. During activation, E cells produce IL2, although the whole process can be inhibited by the presence of co-localized R cells. Activated E (EA) and R (RA) enter the cell cycle (becoming cycling cells) when receiving enough signal from IL2 or another external cytokine (IL-α) in the case of E cells. In the absence of enough cytokines, activated T cells become inactivated, where a fraction of cells simply returns back to the resting state and the other dies. Cycling E (EC) and R (RC) cells divide with a constant rate generating two new resting E or R cells, respectively. Memory T cells are assumed as being always in a sort of naturally activated state (even without any strong cognate interaction with APCs). Activated M (MA) cells enter the cell cycle when receiving enough signals from IL2 or another external cytokine (IL-m). Cycling M cells (MC) divide generating two new activated M cells.
Figure 3
Figure 3
Interactions between IL2 and T cells in the model are mediated by the IL2 receptor (IL2R), which is formed by three chains: alpha, beta, and gamma chain. These chains are combined dynamically in multi-step process at the cell surface, upon IL2 binding, to conform the two known signaling forms of the IL2 receptors: high affinity alpha-beta-gamma and intermediate affinity beta-gamma receptor. In the model, the mean number of such signaling IL2-IL2R complexes per activated T cell are counted, and the probability of becoming a cycling cell is computed with a sigmoid function of the mean number of bound cytokines signaling receptors per cell (as shown at the right side of the arrow).
Figure 4
Figure 4
Illustration of the steady states obtained from numerical simulations of the model. (A,B) shows the proportion of the total T cell number corresponding to helper (E), regulatory (R), and memory (M) T cells. The situation showed in (A), corresponds to the autoimmune steady state (IS) where the memory and helper T cells dominate the system. The situation depicted in (B), correspond to the tolerant steady state (TS) where the regulatory T cells dominate the dynamics. The graph in (C) illustrates how these two types of steady state of the system co-exist in the same region of parameter values (the region of bistability). It is shown how different initial conditions, changing just the proportion of E, R, and M cells at time t = 0, leads to trajectories taking the system either in the tolerant (TS) or the autoimmune (IS) steady state.
Figure 5
Figure 5
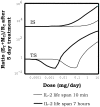
Effect of injections of IL2, on the proportion of helper + memory T cells versus regulatory T cells [ratio (E + M)/R], in a system initialized either in tolerant (TS) or the autoimmune (IS) steady state. The graph shows the ratio (E + M)/R attained in the system right after 5 days of continuous injections of the indicated dose (x axis of the graph) of an IL2 with either 10 min (thin curves) or 7 h (thick curves) life span in solution. It can be seen how when the simulations start with a system at the TS, the ratio (E + M)/R reduce its values for intermediate dose of the treatment. This is a direct consequence of a preferential expansion of the R cells in the system. However, if the dose is further increased then the ratio (E + M)/R is significantly increased. This is a direct consequence of the expansion of helper and memory T cells, by the treatment application. When the treatment start on a system at the IS, then increasing the dose always leads to an increase of the ratio (E + M)/R. This is, it further increments the number of E and R cells in the system. Interestingly increasing the life span of the injected IL2 moves to lower values the dose ranges where treatment is effective, but does not change the qualitative pattern of response observed.
Figure 6
Figure 6
Effect of the simulation of treatments of IL2 depletion, using different anti-IL2 antibodies. mAbs in the simulation, can block the interaction of IL2 with the alpha (face alpha mAb), or with the beta (face beta mAb) or with both (fully blocking mAb) chains of the IL2R. The graphs in (A) corresponds to the case in which the treatment induces a breakdown of the preexistent tolerant steady state, i.e., a transition to the autoimmune steady state. The graphs in (B) corresponds to the case in which treatment induces tolerance, taking into the tolerant steady state, a system initially set in the autoimmune steady state. Breakdown of a preexistent tolerant state requires a minimal effective dose of mAb and treatment duration [graph in the right side of (A)]. In this scenario, face alpha mAbs are more efficient than face beta or fully blocking mAb. This means that the latter need higher doses of mAb to achieve a similar effect. Induction of tolerance requires minimum treatment duration with a mAb dose inside an intermediate window of values [graph in the right side of (B)]. This effect is obtained when face alpha, face beta, or fully blocking mAbs are used.
Figure 7
Figure 7
The graph summarizes the results of simulations of a model system set initially to the IS and then perturbed with, an initial dose of the face beta mAb, which is periodically reduced to the half at the indicated time (x axis). The curve indicates the minimal value of the initial mAb dose required to induce tolerance (taking the system into the tolerant steady state) with the applied treatment.
Figure 8
Figure 8
Effect of injections for five days of the indicated doses of immune-complexes of IL2 plus antibodies anti-IL2, on the ratio of helper + memory T cells versus regulatory T cells [ratio (E + M)/R], in a system initialized either in tolerant (TS) or the autoimmune (IS) steady state. Different immune-complexes differ on the class of mAb used to form it (face alpha, face beta or fully blocking mAbs). immune-complexes are always formed with a 1:2 molar ratio of mAbs:IL2 and the dose applied is reported in terms of the mass of IL2 injected. If the simulations start with a system at the TS, immune-complexes formed with face beta or fully blocking mAbs reduce the ratio (E + M)/R for some intermediate dose values and then increases it for higher dose values. This is a pattern of response, qualitatively similar to that obtained with IL2 injection, but significantly displaced to the range of lower doses of IL2. If face alpha mAbs are used to form the complex the pattern of response obtained is qualitatively different. The ratio (E + M)/R always increase (favoring the expansion of E and M cells) and the larger the dose applied the larger the increment. If the simulations start with a system at the IS, all the possible immune-complexes behave qualitatively like the IL2 alone, they promote in dose-dependent way a further expansion of E and R cells, increasing the ratio (E + M)/R.
Figure 9
Figure 9
The graph shows the minimal effective dose of mAb (left y axis) or IL2 (right y axis) versus treatment duration, required to induce the transition to the IS in a system initialized in the TS, for the treatment with immune-complexes formed with face alpha mAbs in the optimal molar proportion 1:2 (mAb:IL2). For direct comparison the equivalent curves obtained for treatments with the same mAbs alone or the IL2 alone are also depicted. It can be seen that the injection of this class of immune complex is more efficient than the injection of the mAb or the IL2 alone to breakdown tolerance in an initial tolerant system, i.e., it requires less dose of either the mAbs or IL2 as compared to the independent treatments.
Figure 10
Figure 10
The graph in (A) shows the effect of injections for 5 days at the indicated dose of different mutant variants of IL2 on the ratio of helper + memory T cells versus regulatory T cells [ratio (E + M)/R], in a system initialized either in the tolerant (TS) or the autoimmune (IS) steady state. Mutants differ on their capacity to bind to the different chains of the IL2R. Alpha-plus and Beta-plus mutants have higher binding affinity than wild-type IL2 respectively for the alpha chain (f α = 1000, f β = 1) and the beta chain (f α = 1, f β = 1000), while No-alpha mutant lack the binding to the alpha chain (f α = 0.001, f β = 1). All mutant variants were simulated with a life span of 7 h. If the simulations start with a system at the TS, Alpha-plus mutant reduces the ratio (E + M)/R for some intermediate dose values and then increases it for higher dose values. This is a pattern of response, qualitatively similar to that obtained with IL2 injection, although with a slighter wider range of treatment dose with ratio (E + M)/R reduced from its starting value. If No-alpha or Beta-plus mutants are used the pattern of response obtained is qualitatively different. The ratio (E + M)/R always increase (favoring the expansion of E and M cells) and the larger the dose applied the larger the increment. If the simulations start with a system at the IS, all the mutants variants behave like the wild-type IL2, they promote in dose-dependent way a further expansion of E and R cells, increasing the ratio (E + M)/R. The graph in (B) shows the minimal effective dose versus the treatment duration, required to induce the transition to the IS in a system initialized in the TS, for the treatment with different variants of IL2 mutants. It can be seen that the injection of No-alpha and Beta-Plus IL2 mutants is more efficient than the injection of wild-type IL2 alone to breakdown tolerance in an initial tolerant system, i.e., it requires less dose to achieve a similar effect.

Similar articles

Cited by

References

    1. Kudo-Saito C, Garnett CT, Wansley EK, Schlom J, Hodge JW. Intratumoral delivery of vector mediated IL-2 in combination with vaccine results in enhanced T cell avidity and anti-tumor activity. Cancer Immunol Immunother (2007) 56(12):1897–91010.1007/s00262-007-0332-1 - DOI - PMC - PubMed
    1. Fishman M, Hunter TB, Soliman H, Thompson P, Dunn M, Smilee R, et al. Phase II trial of B7-1 (CD-86) transduced, cultured autologous tumor cell vaccine plus subcutaneous interleukin-2 for treatment of stage IV renal cell carcinoma. J Immunother (2008) 31(1):72–8010.1097/CJI.0b013e31815ba792 - DOI - PubMed
    1. Lin CT, Tsai YC, He L, Yeh CN, Chang TC, Soong YK, et al. DNA vaccines encoding IL-2 linked to HPV-16 E7 antigen generate enhanced E7-specific CTL responses and antitumor activity. Immunol Lett (2007) 114(2):86–9310.1016/j.imlet.2007.09.008 - DOI - PMC - PubMed
    1. Tarpey I, van Loon AA, de Haas N, Davis PJ, Orbell S, Cavanagh D, et al. A recombinant turkey Herpesvirus expressing chicken interleukin-2 increases the protection provided by in ovo vaccination with infectious bursal disease and infectious bronchitis virus. Vaccine (2007) 25(51):8529–3510.1016/j.vaccine.2007.10.006 - DOI - PubMed
    1. Davey RT, Jr, Murphy RL, Graziano FM, Boswell SL, Pavia AT, Cancio M, et al. Immunologic and virologic effects of subcutaneous interleukin 2 in combination with antiretroviral therapy: a randomized controlled trial. JAMA (2000) 284(2):183–910.1001/jama.284.2.183 - DOI - PubMed