. 2013 Dec 13;6(4):10.1007/s12195-013-0309-4.
doi: 10.1007/s12195-013-0309-4.

Highly Transient Molecular Interactions Underlie the Stability of Kinetochore-Microtubule Attachment During Cell Division

Affiliations

Highly Transient Molecular Interactions Underlie the Stability of Kinetochore-Microtubule Attachment During Cell Division

Anatoly V Zaytsev et al. Cell Mol Bioeng. .

Abstract

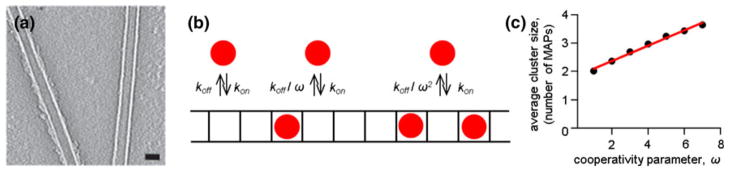
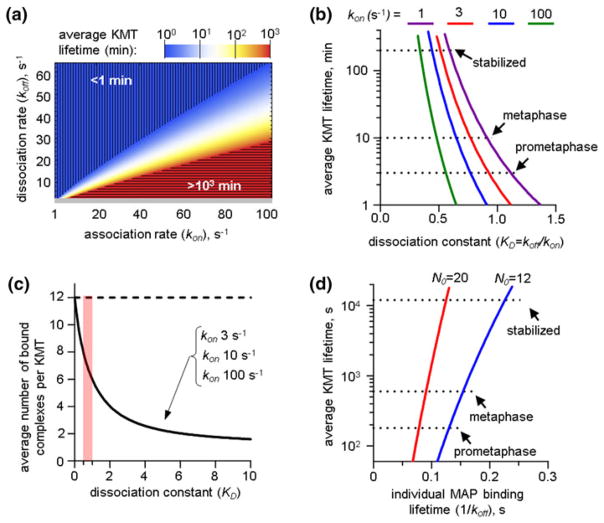
Chromosome segregation during mitosis is mediated by spindle microtubules that attach to chromosomal kinetochores with strong yet labile links. The exact molecular composition of the kinetochore-microtubule interface is not known but microtubules are thought to bind to kinetochores via the specialized microtubule-binding sites, which contain multiple microtubule-binding proteins. During prometaphase the lifetime of microtubule attachments is short but in metaphase it increases 3-fold, presumably owing to dephosphorylation of the microtubule-binding proteins that increases their affinity. Here, we use mathematical modeling to examine in quantitative and systematic manner the general relationships between the molecular properties of microtubule-binding proteins and the resulting stability of microtubule attachment to the protein-containing kinetochore site. We show that when the protein connections are stochastic, the physiological rate of microtubule turnover is achieved only if these molecular interactions are very transient, each lasting fraction of a second. This "microscopic" time is almost four orders of magnitude shorter than the characteristic time of kinetochore-microtubule attachment. Cooperativity of the microtubule-binding events further increases the disparity of these time scales. Furthermore, for all values of kinetic parameters the microtubule stability is very sensitive to the minor changes in the molecular constants. Such sensitivity of the lifetime of microtubule attachment to the kinetics and cooperativity of molecular interactions at the microtubule-binding site may hinder the accurate regulation of kinetochore-microtubule stability during mitotic progression, and it necessitates detailed experimental examination of the microtubule-binding properties of kinetochore-localized proteins.

Keywords: Affinity; Cooperativity; Mathematical modeling; Microtubule binding; Phosphorylation.


Figures

FIGURE 1
FIGURE 1
Theoretical approaches to study kinetochore–MT interactions. (a) Possible designs of kinetochore–MT binding site. The sleeve and ring models assume that the MAPs are connected rigidly, so their MT binding is not truly independent. In our model, the MAPs can bind and unbind independently, although their apparent dissociation rate is different when two or more MAPs are found next to each other. (b) Schematic of the model for molecular interactions between the MT and N0-independent MAPs comprising one MT-binding site. Arrows and their labels correspond to the sums of all possible transitions between two different states, e.g., the MT bound to j and j + 1 MAPs. For details see “General Model Description”. (c) Scheme of the stochastic simulation algorithm for model of the entire kinetochore interface with multiple MT-binding sites, see section “Numerical Simulations of the Kinetochore Interface with Multiple MT-Binding Sites”.
FIGURE 2
FIGURE 2
Quantitative estimation of the range of cooperativity parameter for NDC80 complexes. (a) Cryo-electron microscopy image of the MTs pre-incubated with soluble NDC80 protein shows the drastically different degree of protein decoration. The length of MT on the left is about 350 nm, which corresponds to 90 NDC80 complexes bound to each protofilament, assuming that NDC80 binds every tubulin monomer. Bar is 25 nm. Reproduced with permission from Alushin et al. (b) Simplified model to estimate the degree of cooperativity that leads to complete decoration of one but not the adjacent MT, as seen in (a). All binding sites are unoccupied at the beginning of simulation; then MAPs (red circles) bind with association rate kon but their dissociation is inhibited due to cooperativity. See “Model Description” for details. (c) Plot shows how the cooperativity parameter affects the average size of a cluster of MAPs. Calculated for kon = 1 s−1 and on average 50% occupancy of the binding sites in the linear array.
FIGURE 3
FIGURE 3
Analysis of a model with single MT-binding site in case of non-cooperative binding. (a) Two-colored chart shows average KMT lifetime at one site with MAPs that bind the MT with indicated association and dissociation rates. Horizontal hatching corresponds to highly unstable MTs with lifetimes <1 min. Vertical hatching corresponds to overly stabilized MTs with lifetimes >103 min. Gray bar at the bottom of the plot indicates the region with model solutions for koff <2 s−1, which was excluded from subsequent analysis. (b) Plots show the relationship between average KMT lifetime and dissociation constant KD for individual MAPs in a MT-binding site for indicated values of kon. Curve for kon = 1 s−1 corresponds to model solutions for which koff <2 s−1, so they were excluded from further analysis. One can see that the impact of absolute value of kon on this dependence is small. “Stabilized” MTs have lifetime 200 min; such stable KMTs are not seen during normal mitosis but can be obtained when Aurora B kinase, which is one of the major MT-destabilizing factors, is inhibited. (c) Plots show how the number of NDC80 complexes per KMT depends on the value of dissociation constant for three different values of kon. The predicted results do not depend on the value of kon, so the curves overlap completely. Broken line shows the maximum number of NDC80 complexes per site. Pink bar shows the range of KD that corresponds to the physiological KMT stability. (d) Dependence of the average KMT lifetime on the lifetime of individual MAPs was calculated for KD values from 0.4 to 1; these values correspond to 6–8 MAPs bound to one MT at steady-state (pink vertical bar in (c)). This plot was obtained for kon = 10 s−1 but similar results were obtained for kon ranging from 1 to 100 s−1. Different colors show model solutions for different number of MAPs per MT-binding site (12 and 20).
FIGURE 4
FIGURE 4
Impact of MAP cooperativity on MT-MAP interactions at one MT-binding site. (a) Color chart shows the dependency of average lifetime of MT attachment at MT binding site on the values of cooperativity parameter ω and dissociation constant KD. See legend to Fig. 3a for details. (b) Plot shows values of the cooperativity parameter and dissociation constant KD that produce average KMT lifetime 10 min, mimicking the KMTs in metaphase PtK1 cells. (c) Blue curve shows how the average lifetime of MAP’s binding depends on the cooperativity parameter at the physiological rate of KMT turn-over (10 min). Red curve shows the average number of MT-bound MAPs per KMT for different values of cooperativity. (d) Dependence of the average KMT lifetime on the lifetime of individual MAPs was calculated for kon = 10 s−1. For ω>10 the data are not shown because the curve practically merges with the Y axis.
FIGURE 5
FIGURE 5
Model of kinetochore interface with multiple MT-binding sites. (a) Schematic of the kinetochore interface with multiple MT-binding sites (only part of the kinetochore is shown). After MT encounters one of the binding sites with probability Pat, it immediately initiates molecular interactions with all MAPs within this site. Values of model parameters that were used to obtain results in this figure are listed in Table 1. (b) Results of three independent simulations of the kinetochore model. Time zero is a start of calculation, corresponding to the initiation of MT binding to the kinetochore. Grey bar indicates the range for the number of KMTs that was found at metaphase in PtK1 cells. (c) Distribution of the number of MTs per kinetochore in the model with multiple MT binding sites at steady-state. The average predicted KMT number is 25.6 per kinetochore, consistent with structural studies in PtK1 cells. (d) This graph illustrates how molecular parameters KD or ω need to be adjusted to provide the observed stabilization of KMT attachments during metaphase. The average KMT lifetimes in prometaphase and metaphase were 3.5 and 10 min, respectively., The average KMT lifetime in prometaphase was obtained for KD = 3.2 and ω = 3; to calculate average KMT lifetime in metaphase, for columns “KD is regulated” the value of ω was not changed, and KD was found to be 2.7, which is 84% of the prometaphase value. For “ω is regulated” columns the value of KD was not changed, and ω was found to be 3.4, which is 113% of its prometaphase value. (e) Schematic that illustrates quantitative relationship between two time-scales in the model: the lifetime of molecular interactions (microscopic parameters KD and ω) and average KMT lifetime (experimentally measured KMT turnover rate).

Similar articles

Cited by

References

    1. Akiyoshi B, Sarangapani KK, Powers AF, Nelson CR, Reichow SL, Arellano-Santoyo H, Gonen T, Ranish JA, Asbury CL, Biggins S. Tension directly stabilizes reconstituted kinetochore–microtubule attachments. Nature. 2010;468(7323):576–579. - PMC - PubMed
    1. Alberts B, Johnson A, Lewis J, Raff M, Roberts K, Walter P. Molecular Biology of the Cell. 5. New York: Garland Science; 2008. pp. 1082–1086.
    1. Alushin GM, Musinipally V, Matson D, Tooley J, Stukenberg PT, Nogales E. Multimodal microtubule binding by the Ndc80 kinetochore complex. Nat Struct Mol Biol. 2012;19(11):1161–1167. - PMC - PubMed
    1. Alushin GM, Ramey VH, Pasqualato S, Ball DA, Grigorieff N, Musacchio A, Nogales E. The Ndc80 kinetochore complex forms oligomeric arrays along microtubules. Nature. 2010;467(7317):805–810. Molecular Model of a Kinetochore–Microtubule Binding Site. - PMC - PubMed
    1. Aravamudhan P, Felzer-Kim I, Joglekar AP. The budding yeast point centromere associates with two Cse4 molecules during mitosis. Curr Biol. 2013;23(9):770–774. - PMC - PubMed

LinkOut - more resources