

HIV viremia and T-cell activation differentially affect the performance of glomerular filtration rate equations based on creatinine and cystatin C
- PMID: 24376511
- PMCID: PMC3871673
- DOI: 10.1371/journal.pone.0082028
HIV viremia and T-cell activation differentially affect the performance of glomerular filtration rate equations based on creatinine and cystatin C
Erratum in
-
Correction: HIV Viremia and T-cell Activation Differentially Affect the Performance of Glomerular Filtration Rate Equations Based on Creatinine and Cystatin C.PLoS One. 2019 Apr 16;14(4):e0215630. doi: 10.1371/journal.pone.0215630. eCollection 2019. PLoS One. 2019. PMID: 30990858 Free PMC article.
Abstract
Background: Serum creatinine and cystatin C are used as markers of glomerular filtration rate (GFR). The performance of these GFR markers relative to exogenously measured GFR (mGFR) in HIV-positive individuals is not well established.
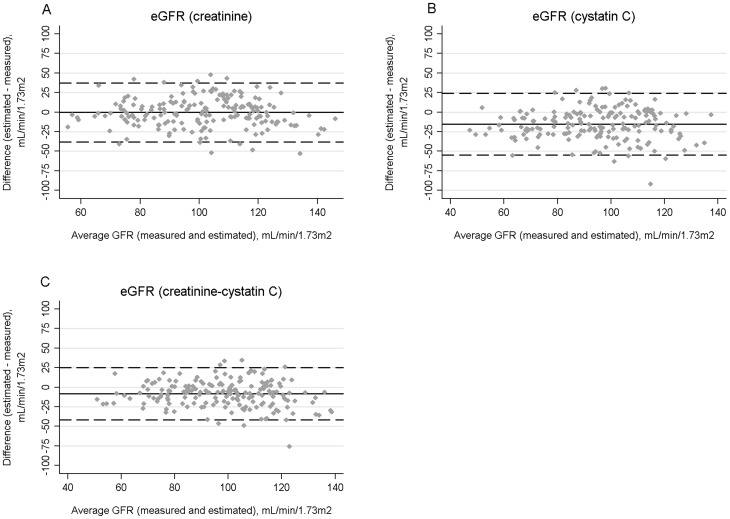
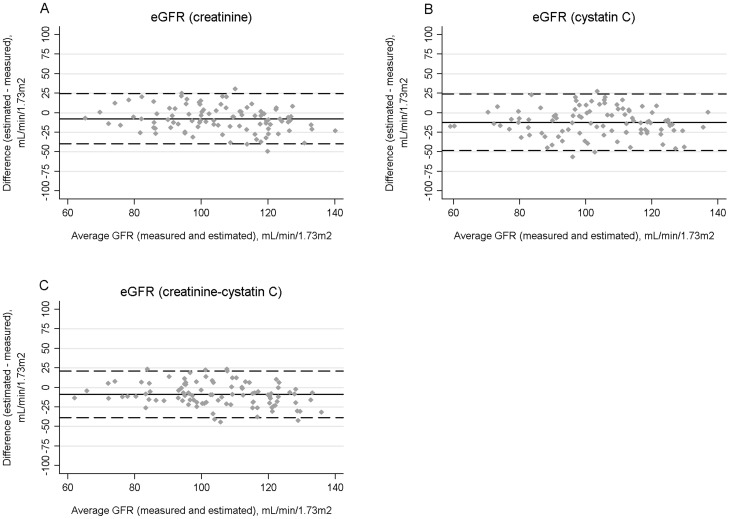
Methods: We assessed the performance of the chronic kidney disease epidemiology collaboration equations based on serum concentrations of creatinine (eGFRcr), cystatin C (eGFRcys) and both biomarkers combined (eGFRcr-cys) in 187 HIV-positive and 98 HIV-negative participants. Measured GFR was calculated by plasma iohexol clearance. Bias and accuracy were defined as the difference between eGFR and mGFR and the percentage of eGFR observations within 30% of mGFR, respectively. Activated CD4 and CD8 T-cells (CD38+ HLA-DR+) were measured by flow cytometry.
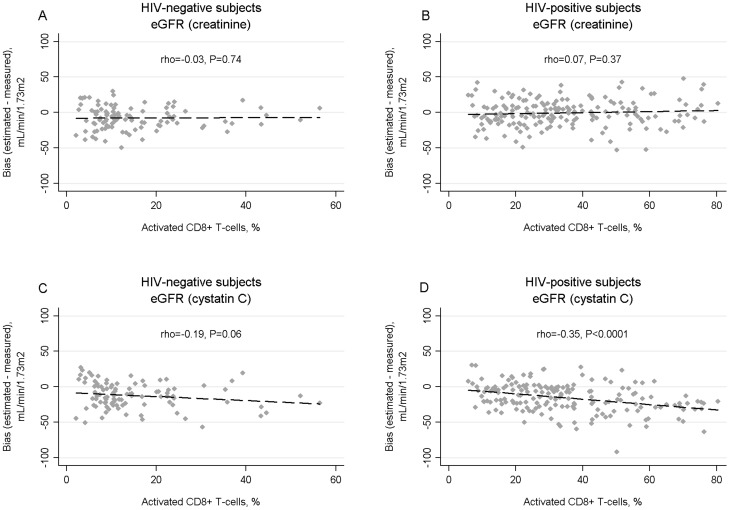
Results: The median mGFR was >100 ml/min/1.73 m(2) in both groups. All equations tended to be less accurate in HIV-positive than in HIV-negative subjects, with eGFRcr-cys being the most accurate overall. In the HIV-positive group, eGFRcys was significantly less accurate and more biased than eGFRcr and eGFRcr_cys. Additionally eGFRcys bias and accuracy were strongly associated with use of antiretroviral therapy, HIV RNA suppression, and percentages of activated CD4 or CD8 T-cells. Hepatitis C seropositivity was associated with larger eGFRcys bias in both HIV-positive and HIV-negative groups. In contrast, eGFRcr accuracy and bias were not associated with HIV-related factors, T-cell activation, or hepatitis C.
Conclusions: The performance of eGFRcys relative to mGFR was strongly correlated with HIV treatment factors and markers of T-cell activation, which may limit its usefulness as a GFR marker in this population.
Conflict of interest statement
Figures
References
-
- Dharnidharka VR, Kwon C, Stevens G (2002) Serum cystatin C is superior to serum creatinine as a marker of kidney function: a meta-analysis. Am J Kidney Dis 40: 221–226. - PubMed
-
- Gagneux-Brunon A, Mariat C, Delanaye P (2012) Cystatin C in HIV-infected patients: promising but not yet ready for prime time. Nephrol Dial Transplant 27: 1305–1313. - PubMed
-
- Luc G, Bard JM, Lesueur C, Arveiler D, Evans A, et al. (2006) Plasma cystatin-C and development of coronary heart disease: The PRIME Study. Atherosclerosis 185: 375–380. - PubMed
-
- Earley A, Miskulin D, Lamb EJ, Levey AS, Uhlig K (2012) Estimating equations for glomerular filtration rate in the era of creatinine standardization: a systematic review. Ann Intern Med 156: 785–W-278, 785-795, W-270, W-271, W-272, W-273, W-274, W-275, W-276, W-277, W-278. - PubMed
Publication types
MeSH terms
Substances
Grants and funding
LinkOut - more resources
Full Text Sources
Other Literature Sources
Medical
Research Materials
Miscellaneous
