. 2013 Dec 20;8(12):e82762.
doi: 10.1371/journal.pone.0082762. eCollection 2013.

Bilateral functional connectivity of the basal ganglia in patients with Parkinson's disease and its modulation by dopaminergic treatment

Affiliations

Bilateral functional connectivity of the basal ganglia in patients with Parkinson's disease and its modulation by dopaminergic treatment

Simon Little et al. PLoS One. .

Abstract

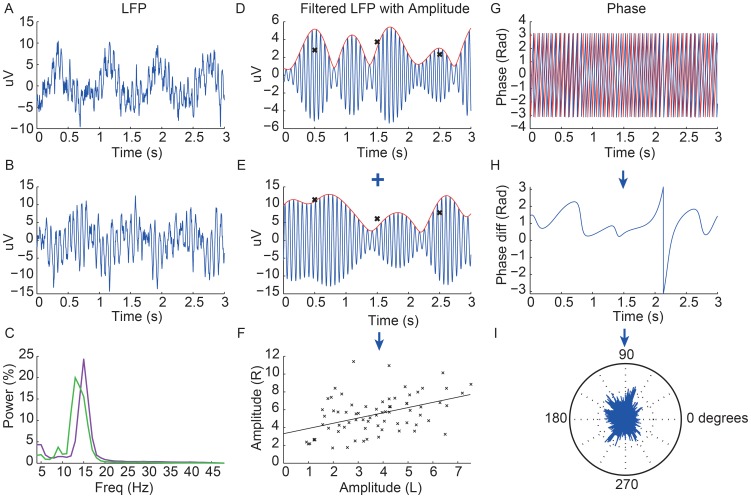
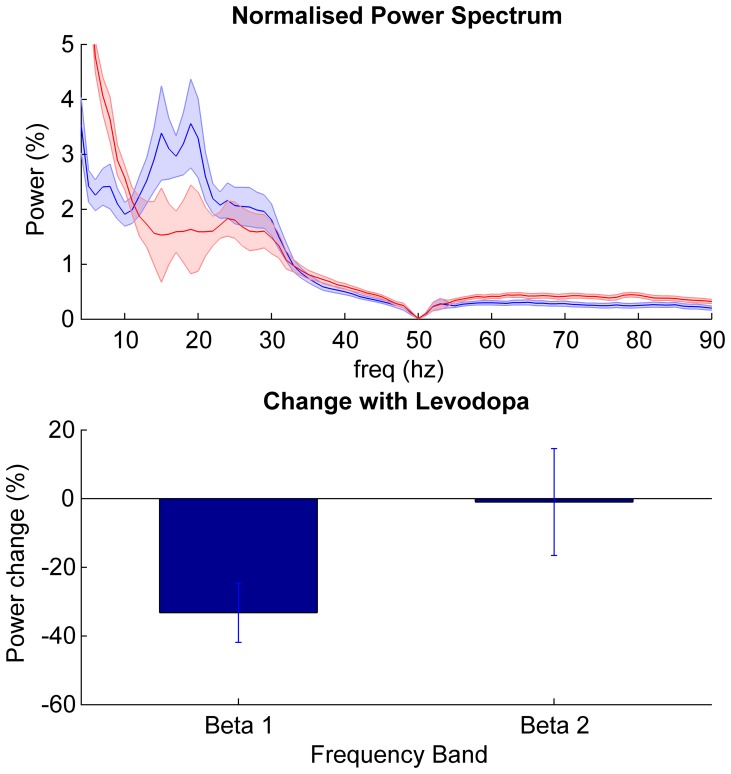
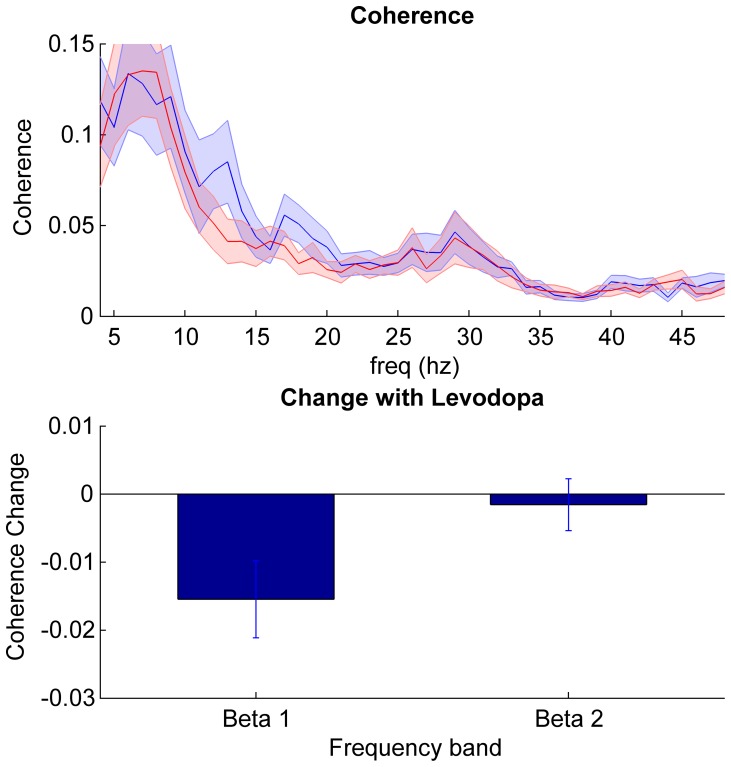
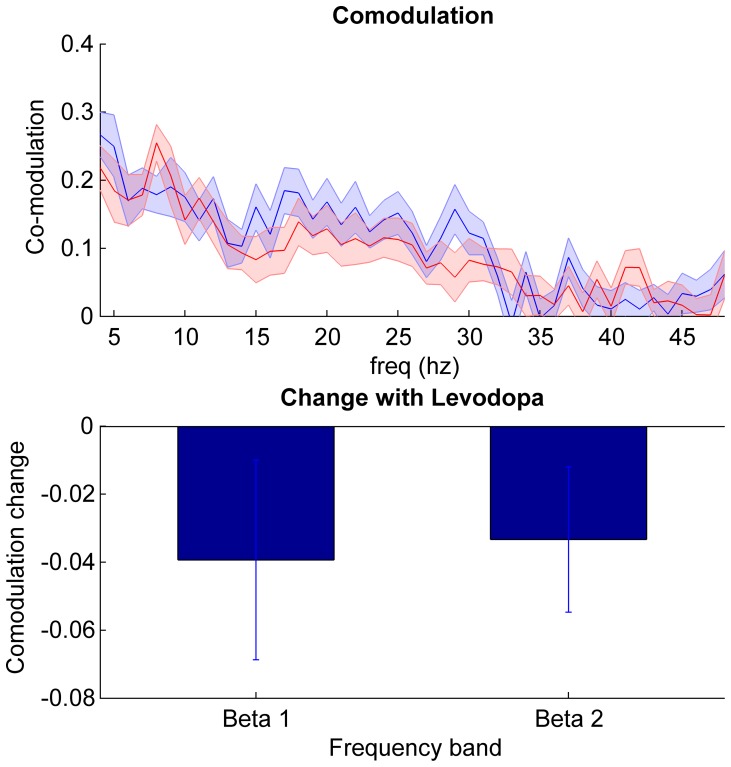
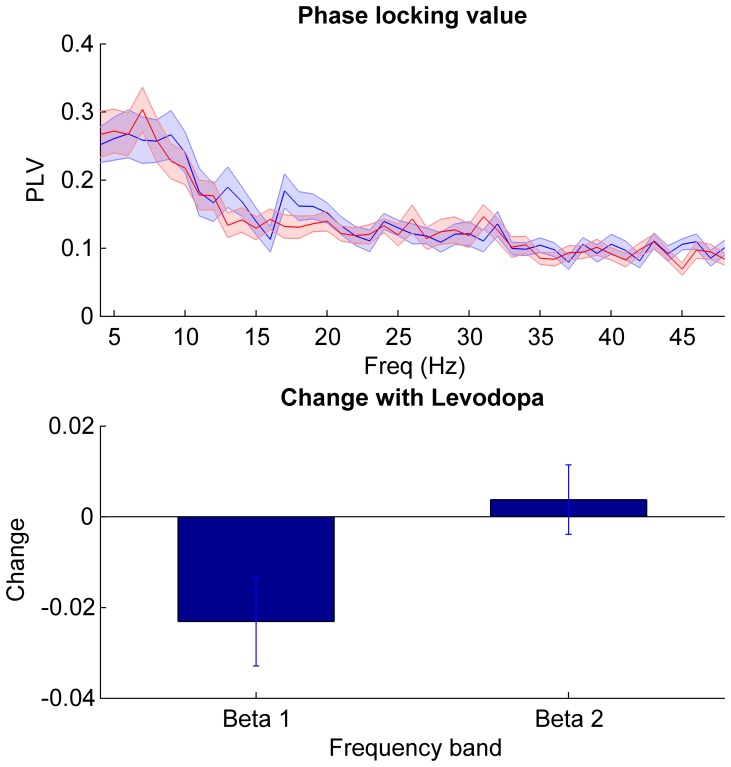
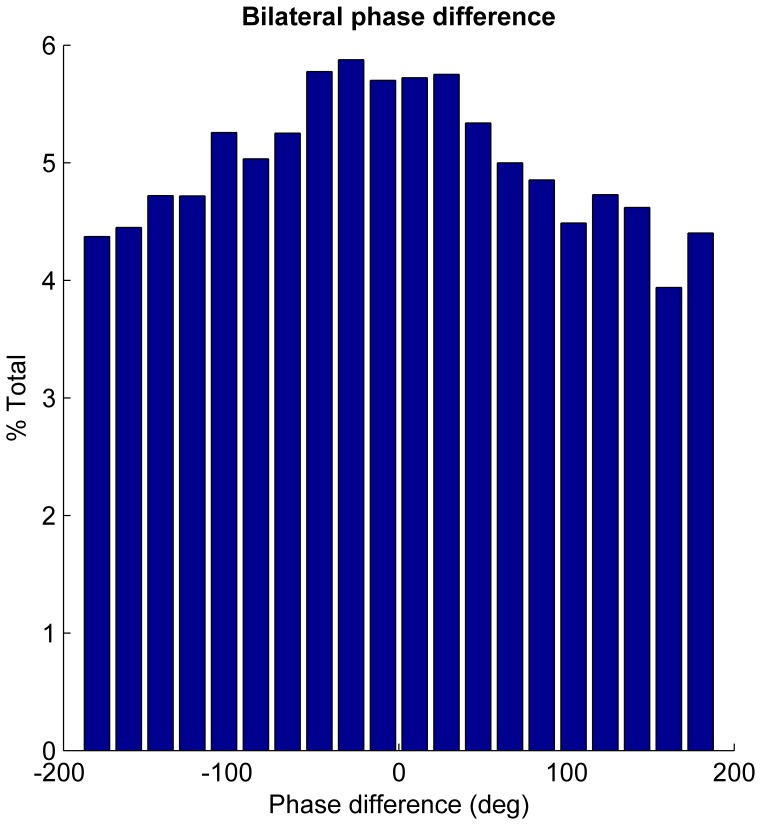
Parkinson's disease is characterised by excessive subcortical beta oscillations. However, little is known about the functional connectivity of the two basal ganglia across hemispheres and specifically the role beta plays in this. We recorded local field potentials from the subthalamic nucleus bilaterally in 23 subjects with Parkinson's disease at rest, on and off medication. We found suppression of low beta power in response to levodopa (t22 = -4.4, p<0.001). There was significant coherence between the two sides in the beta range in 19 of the subjects. Coherence was selectively attenuated in the low beta range following levodopa (t22 = -2.7; p = 0.01). We also separately analysed amplitude co-modulation and phase synchronisation in the beta band and found significant amplitude co-modulation and phase locking values in 17 and 16 subjects respectively, off medication. There was a dissociable effect of levodopa on these measures, with a significant suppression only in low beta phase locking value (t22 = -2.8, p = 0.01) and not amplitude co-modulation. The absolute mean values of amplitude co-modulation (0.40 ± 0.03) and phase synchronisation (0.29 ± 0.02) off medication were, however, relatively low, suggesting that the two basal ganglia networks may have to be approached separately with independent sensing and stimulation during adaptive deep brain stimulation. In addition, our findings highlight the functional distinction between the lower and upper beta frequency ranges and between amplitude co-modulation and phase synchronization across subthalamic nuclei.


Conflict of interest statement

Competing Interests: Andrea Kuhn has received honoraria from Medtronic, St. Jude Medical, Novartis, Bayer AG, and support for travel to conferences by Ipsen Pharma. Peter Brown has received consultancy fees from Medtronic and Sapiens. This does not alter the authors’ adherence to all the PLOS ONE policies on sharing data and materials.

Figures

Figure 1
Figure 1. Data from one subject off levodopa showing LFPs with extracted amplitude and phase.
The first column shows 3(A = left STN, B = right STN) and their respective power spectra (C; left STN - purple, right STN - green). The second column shows the LFP pass-band filtered around the corresponding beta peak (blue) of each STN (D = left STN, E = right STN) with the amplitude shown in red. The crosses show the average amplitude for each 1 second window and the final graph shows the correlation of these 1 s average amplitudes across the two sides over 74 s duration record, with a linear regression line through them (F). The r value of this linear regression line is taken as the value of the amplitude co-modulation for any given subject. In this example r = 0.57, p<0.001. The right column shows the superimposed phase of the two LFP signals (red = left STN and blue = right STN) over 3 s (G) with the phase difference over this period shown below (H). A rose plot underneath shows the proportion of phase difference vectors at all points for the whole recording around the unit circle (I). The length of the average of these vectors is then taken as the value of the phase locking value (PLV), which in this case was 0.22. Note low frequency oscillations at about 1 Hz likely to be cardiac pulse artefact in A and B. Despite this, modulations in the amplitude envelopes of the beta band filtered LFP activity shown in D and E are not time-locked to the low frequency cardiac pulse artifacts in 1A and B.
Figure 2
Figure 2. Power changes in STN.
Top panel shows mean ± SEM power spectral density of all 23 subjects in the off (blue) and on (red) medication state. Bottom panel shows the mean ± SEM % change between the two states (on – off medication) in the beta sub-bands. Only the power suppression in the beta 1 band following levodopa was significant (t22 = −4.4, p<0.001).
Figure 3
Figure 3. Coherence between STNs.
Top panel shows mean ± SEM coherence of all 23 subjects in the off (blue) and on (red) medication state. Bottom panel shows the mean ± SEM % change between the two states (on –off medication) in the beta sub-bands. Only the coherence suppression in the beta 1 band following levodopa was significant (t22 = −2.7; p = 0.01).
Figure 4
Figure 4. Amplitude co-modulation between STNs.
Top panel shows mean ± SEM amplitude co-modulation of all 23 subjects in the off (blue) and on (red) medication state. Bottom panel shows the mean ± SEM % change between the two states (on – off medication) in the beta sub-bands. There was no significant effect of levodopa, frequency band or interaction between the two (see results).
Figure 5
Figure 5. Phase synchronisation between STNs.
Top panel shows mean ± SEM amplitude PLV of all 23 subjects in the off (blue) and on (red) medication state. Bottom panel shows the mean ± SEM % change in PLV between the two states (on – off medication) in the beta sub-bands. Only the beta 1 band PLV was suppressed following levodopa (t22 = −2.8, p = 0.01).
Figure 6
Figure 6. Histogram of beta phase differences between bilateral STN.
Histogram of all phase differences across 23 subjects at peak beta frequency off medication, demonstrating predominance of zero phase lag.

References

    1. Tepper JM, Abercrombie ED, Bolam JP (2007) Basal ganglia macrocircuits. Prog Brain Res 160: 3–7. - PubMed
    1. Williams D (2002) Dopamine-dependent changes in the functional connectivity between basal ganglia and cerebral cortex in humans. Brain 125: 1558–1569. - PubMed
    1. Litvak V, Jha A, Eusebio A, Oostenveld R, Foltynie T, et al.. (2011) Resting oscillatory cortico-subthalamic connectivity in patients with Parkinson’s disease. Brain 134, 359–374. - PubMed
    1. Amirnovin R, Williams ZM, Cosgrove GR, Eskandar EN (2004) Visually guided movements suppress subthalamic oscillations in Parkinson’s disease patients. J Neurosci 24: 11302–11306. - PMC - PubMed
    1. Hammond C, Bergman H, Brown P (2007) Pathological synchronization in Parkinson’s disease: networks, models and treatments. Trends Neurosci 30: 357–364. - PubMed

Publication types

MeSH terms