. 2013 Dec 20;8(12):e83252.
doi: 10.1371/journal.pone.0083252. eCollection 2013.

Proof of the concept to use a malignant B cell line drug screen strategy for identification and weight of melphalan resistance genes in multiple myeloma

Affiliations

Proof of the concept to use a malignant B cell line drug screen strategy for identification and weight of melphalan resistance genes in multiple myeloma

Martin Bøgsted et al. PLoS One. .

Abstract

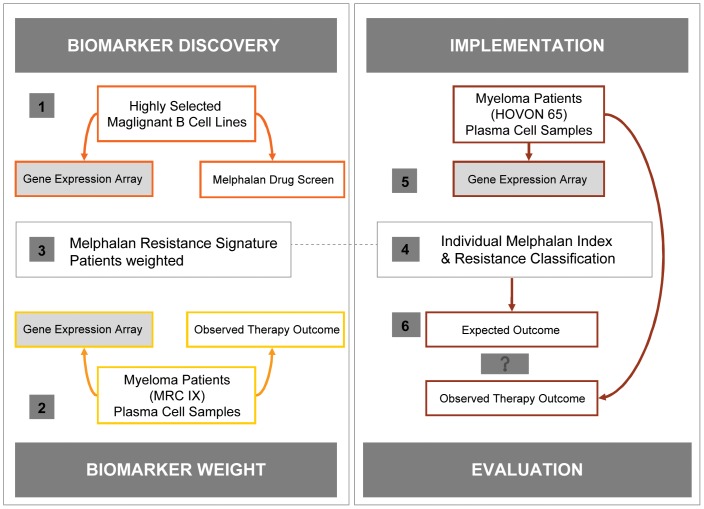
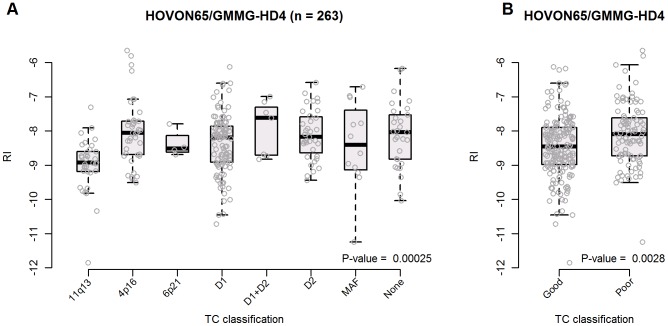
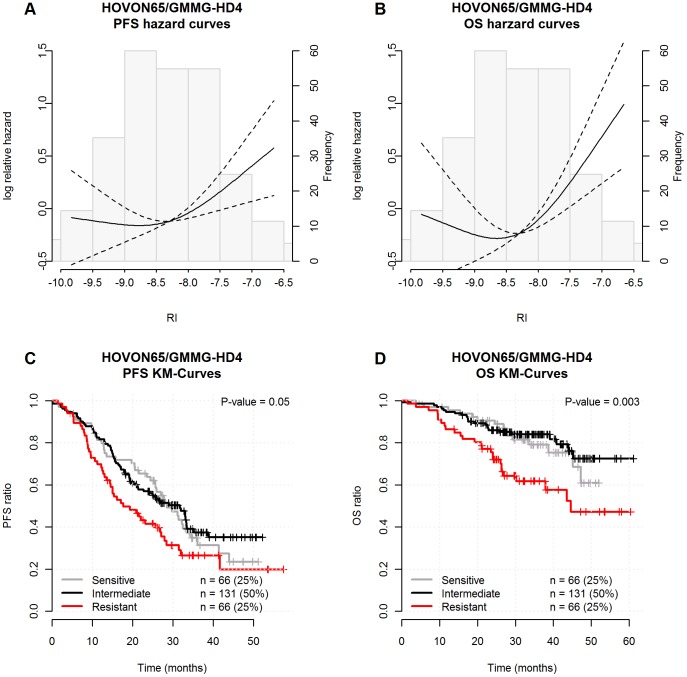
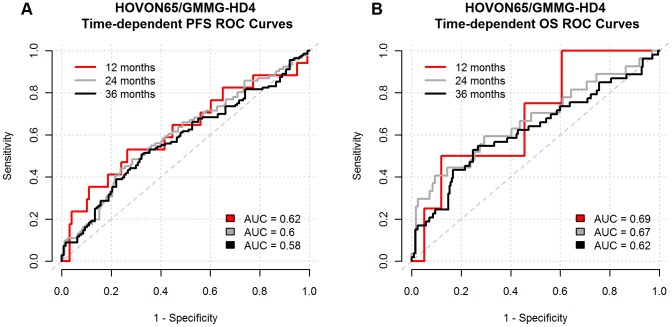
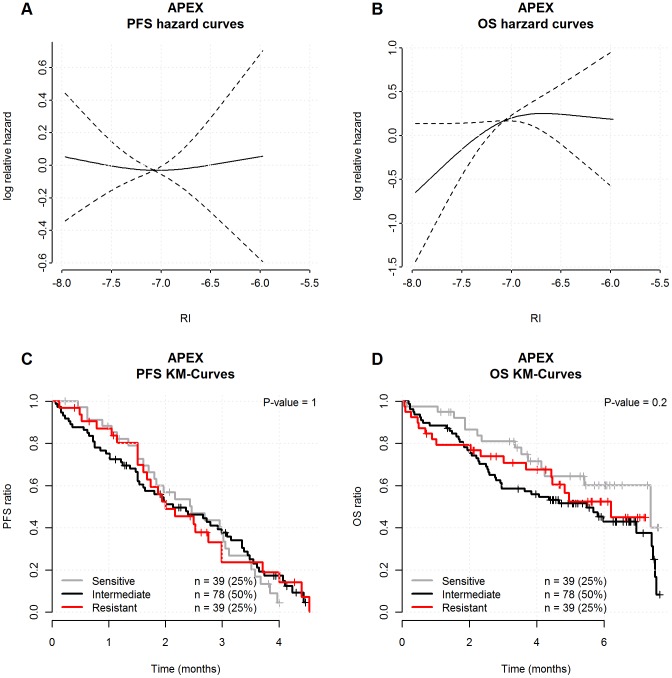
In a conceptual study of drug resistance we have used a preclinical model of malignant B-cell lines by combining drug induced growth inhibition and gene expression profiling. In the current report a melphalan resistance profile of 19 genes were weighted by microarray data from the MRC Myeloma IX trial and time to progression following high dose melphalan, to generate an individual melphalan resistance index. The resistance index was subsequently validated in the HOVON65/GMMG-HD4 trial data set to prove the concept. Biologically, the assigned resistance indices were differentially distributed among translocations and cyclin D expression classes. Clinically, the 25% most melphalan resistant, the intermediate 50% and the 25% most sensitive patients had a median progression free survival of 18, 32 and 28 months, respectively (log-rank P-value = 0.05). Furthermore, the median overall survival was 45 months for the resistant group and not reached for the intermediate and sensitive groups (log-rank P-value = 0.003) following 38 months median observation. In a multivariate analysis, correcting for age, sex and ISS-staging, we found a high resistance index to be an independent variable associated with inferior progression free survival and overall survival. This study provides clinical proof of concept to use in vitro drug screen for identification of melphalan resistance gene signatures for future functional analysis.


Conflict of interest statement

Competing Interests: The authors have declared that no competing interests exist.

Figures

Figure 1
Figure 1. Summary of the stepwise development, adjustment and validation of the resistance gene list.
Numbers relate to step 1–6 as illustrated in the figure. 1) First, The analysis starts by identification of candidate biomarkers by a sparse partial least squares algorithm (SPLS) to build a predictive gene list based on correlations with the GI50 values of the cell line panel, regarded as “biomarker discovery”. 2) Second, the candidate genes were trained to ensure weighted expression in the myeloma data set from the patient cohort in the clinical trial MRC Myeloma IX, to derive a gene signature model, predictive of resistance to melphalan – a step which is regarded as biomarker weighting. The weighting was performed by multivariate Cox regression with PFS as dependent variable and gene expression of the 19 genes as independent variables resulting in a weighted gene signature. 3) The weighted melphalan resistance gene signature is used to define a melphalan RI. 4) The signature is used to classify each tumour from the clinical trial HOVON65/GMMG-HD4 based on the individual GEP data. 5) The RIs were defined to be the linear predictor of the multivariate Cox regression, i.e. calculated for each individual clinical sample by a linear combination of the 19 gene expressions using the weights from the multivariate Cox regression model. 6) Finally, the molecular prediction of resistance to melphalan therapy was compared to the actual observed PFS and OS. – a step regarded as implementation and evaluation.
Figure 2
Figure 2. The melphalan RI differ between TC classes.
The translocation and cyclin D defined TC classification involving early oncogenic events were applied to the HOVON65/GMMG-HD4 data set and in panel A) each of the 8 classes of tumours showed different melphalan RI levels (P-value  = 0.00025). In panel B) these classes were grouped into two groups with good or poor prognosis with different melphalan RI levels (P-value  = 0.0028).
Figure 3
Figure 3. Melphalan resistance gene index validation by clinical outcome.
The individual RIs were assigned from gene expression data of the HOVON 65/GMMG-HD4 trial dividing tumor samples into groups of sensitive patients with low 0–25% RI, intermediate RI from 25–75% and resistant patients with the highest 75–100% RI. The impact of this assignment was subsequently evaluated with respect to PFS and overall OS as illustrated by log relative hazard for PFS (1A) and OS (1B) as a function of the individual RI levels. The P-values are the maximum likelihood tests for no RCS-association between log Relative Hazard and the RI and the dashed lines represent 95% confidence intervals. A landmark Kaplan-Meier analysis was performed from the time of HDM and we found that resistant, intermediate and sensitive patient groups had a median PFS of 18, 32 and 28 months, respectively (1C). The OS for the resistant group had a median of 45 months but not reached for the intermediate and resistant groups (1D) following a median observation time of 38 months. The P-values are the log-rank-test results for no difference between the estimated survival curves.
Figure 4
Figure 4. The poor diagnostic accuracy illustrated by ROC curves.
The diagnostic accuracy of the RI to predict the PFS and OS was evaluated by ROC curves. The true positive rate (sensitivity) was plotted as a function of the false positive rate (1- specificity) for a series of time dependent cut-off points illustrating the level of discrimination is quantified by area under curve (AUC) for OS and PFS being poor between 60–70%.
Figure 5
Figure 5. The melphalan RI in patients treated without HDM.
Illustration of the negative validation of the approach in a data set from156 relapsed MM patients treated without HDM by inclusion into the APEX trial (18) that compared single-agent bortezomib to high-dose dexamethasone. The individual RIs were assigned from each patients' gene expression data of the APEX trial dividing tumor samples into groups of sensitive patients with the low 0–25% RI, intermediate RI between 25–75% and resistant patients with the highest 75–100% RI. The impact of this assignment was subsequently evaluated with respects to PFS and overall OS as illustrated by log relative hazard for PFS (5A) and OS (5B) as a function of the individual RI levels. The P-values are the maximum likelihood tests for no RCS-association between log Relative Hazard and the RI and the dashed lines represent 95% confidence intervals. A landmark Kaplan-Meier analysis was performed from the time of treatment start which found that resistant, intermediate and sensitive patient groups had no significant differences with respect to the prediction of PFS as well as OS from time of relapse therapy. The P-values are the log-rank-test results for no difference in survival curves.

References

    1. Storm HH, Klint A, Tryggvadóttir L, Gislum M, Engholm G, et al. (2010) Trends in the survival of patients diagnosed with malignant neoplasms of lymphoid, haematopoietic, and related tissue in the Nordic countries 1964-2003 followed up to the end of 2006. Acta Oncol 49: 694–712. - PubMed
    1. Palumbo A, Bringhen S, Ludwig H, Dimopoulos MA, Bladé J, et al. (2011) Personalized therapy in multiple myeloma according to patient age and vulnerability: a report of the European Myeloma Network (EMN). Blood 118: 4519–4529. - PubMed
    1. Fonseca R, Bergsagel PL, Drach J, Shaughnessy J, Gutierrez N, et al. (2009) International Myeloma Working Group. International Myeloma Working Group molecular classification of multiple myeloma: spotlight review. Leukemia 23: 2210–2221. - PMC - PubMed
    1. Bergsagel PL, Kuehl WM, Zhan F, Sawyer J, Barlogie B, et al. (2005) Cyclin D dysregulation: an early and unifying pathogenic event in multiple myeloma. Blood 106: 296–303. - PMC - PubMed
    1. Greipp PR, San Miguel J, Durie BG, Crowley JJ, Barlogie B, et al. (2005) International staging system for multiple myeloma. J Clin Oncol 23: 3412–3420. Epub 2005 Apr 4. Erratum (2005) J Clin Oncol 23: 6281. - PubMed

Publication types

MeSH terms