. 2013 Dec 23;8(12):e84951.
doi: 10.1371/journal.pone.0084951. eCollection 2013.

The effects of industry sponsorship on comparator selection in trial registrations for neuropsychiatric conditions in children

Affiliations

The effects of industry sponsorship on comparator selection in trial registrations for neuropsychiatric conditions in children

Adam G Dunn et al. PLoS One. .

Abstract

Pediatric populations continue to be understudied in clinical drug trials despite the increasing use of pharmacotherapy in children, particularly with psychotropic drugs. Most pertinent to the clinical selection of drug interventions are trials directly comparing drugs against other drugs. The aim was to measure the prevalence of active drug comparators in neuropsychiatric drug trials in children and identify the effects of funding source on comparator selection. We analyzed the selection of drugs and drug comparisons in clinical trials registered between January 2006 and May 2012. Completed and ongoing interventional trials examining treatments for six neuropsychiatric conditions in children were included. Networks of drug comparisons for each condition were constructed using information about the trial study arms. Of 421 eligible trial registrations, 228 (63,699 participants) were drug trials addressing ADHD (106 trials), autism spectrum disorders (47), unipolar depression (16), seizure disorders (38), migraines and other headaches (15), or schizophrenia (11). Active drug comparators were used in only 11.0% of drug trials while 44.7% used a placebo control and 44.3% no drug or placebo comparator. Even among conditions with well-established pharmacotherapeutic options, almost all drug interventions were compared to a placebo. Active comparisons were more common among trials without industry funding (17% vs. 8%, p=0.04). Trials with industry funding differed from non-industry trials in terms of the drugs studied and the comparators selected. For 73% (61/84) of drugs and 90% (19/21) of unique comparisons, trials were funded exclusively by either industry or non-industry. We found that industry and non-industry differed when choosing comparators and active drug comparators were rare for both groups. This gap in pediatric research activity limits the evidence available to clinicians treating children and suggests a need to reassess the design and funding of pediatric trials in order to optimize the information derived from pediatric participation in clinical trials.


Conflict of interest statement

Competing Interests: The authors have declared that no competing interests exist.

Figures

Figure 1
Figure 1. Neuropsychiatric interventional studies involving children, registered on clinicaltrials.gov January 2006 to May 2012.
The set of pediatric interventional studies registered on ClinicalTrials.gov that met the inclusion criteria and included at least one drug intervention (blue); or only non-drug interventions (grey). Abbreviations: ADHD: attention deficit hyperactivity disorder; ASD: autism spectrum disorder.
Figure 2
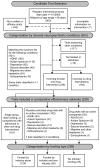
Figure 2. Selection and classification of clinical drug trials.
The trial selection and classification used in the analyses are also classified by funding type.
Figure 3
Figure 3. The drug treatment network for ADHD, indicating funding source.
The network of drug treatments for 106 ADHD trials, where the areas of circles are proportional to the total number of trials examining the treatments, and the thickness of the lines are proportional to the number of active comparisons between drugs or with placebo. Black represents industry-funded trials; grey represents trials partially funded by industry; and blue represents non-industry funding. The numerical labels are the number of trials in each group, matching the colors.
Figure 4
Figure 4. The drug treatment network for autism spectrum disorders, indicating funding source.
The network of drug treatments for 47 autism spectrum disorder trials, where the areas of circles are proportional to the total number of trials examining the treatments, and the thickness of the lines are proportional to the number of active comparisons between drugs or with placebo. Black represents industry-funded trials; grey represents trials partially funded by industry; and blue represents non-industry funding. The numerical labels are the number of trials in each group, matching the colors.
Figure 5
Figure 5. The drug treatment network for seizure disorders, indicating funding source.
The network of drug treatments for 38 seizure disorder trials, where the areas of circles are proportional to the total number of trials examining the treatments, and the thickness of the lines are proportional to the number of active comparisons between drugs or with placebo. Black represents industry-funded trials; grey represents trials partially funded by industry; and blue represents non-industry funding. The numerical labels are the number of trials in each group, matching the colors.
Figure 6
Figure 6. The drug treatment network for unipolar depression, indicating funding source.
The network of drug treatments for 16 unipolar depression trials, where the areas of circles are proportional to the total number of trials examining the treatments, and the thickness of the lines are proportional to the number of active comparisons between drugs or with placebo. Black represents industry-funded trials; grey represents trials partially funded by industry; and blue represents non-industry funding. The numerical labels are the number of trials in each group, matching the colors.
Figure 7
Figure 7. The drug treatment network for migraines and other headaches, indicating funding source.
The network of drug treatments for 15 migraines and other headaches trials, where the areas of circles are proportional to the total number of trials examining the treatments, and the thickness of the lines are proportional to the number of active comparisons between drugs or with placebo. Black represents industry-funded trials; grey represents trials partially funded by industry; and blue represents non-industry funding. The numerical labels are the number of trials in each group, matching the colors.
Figure 8
Figure 8. The drug treatment network for schizophrenia, indicating funding source.
The network of drug treatments for 11 schizophrenia trials, where the areas of circles are proportional to the total number of trials examining the treatments, and the thickness of the lines are proportional to the number of active comparisons between drugs or with placebo. Black represents industry-funded trials; grey represents trials partially funded by industry; and blue represents non-industry funding. The numerical labels are the number of trials in each group, matching the colors.

References

    1. Bourgeois FT, Murthy S, Pinto C, Olson KL, Ioannidis JP et al. (2012) Pediatric versus adult drug trials for conditions with high pediatric disease burden. Pediatrics 130: 285-292. doi:10.1542/peds.2012-0139. PubMed: 22826574. - DOI - PMC - PubMed
    1. Cohen E, Goldman RD, Ragone A, Uleryk E, Atenafu EG et al. (2010) Child vs adult randomized controlled trials in specialist journals: a citation analysis of trends, 1985-2005. Arch Pediatr Adolesc Med 164: 283-288. doi:10.1001/archpediatrics.2009.291. PubMed: 20194264. - DOI - PubMed
    1. Sammons HM, Choonara I (2005) Clinical trials of medication in children, 1996-2002. Eur J Clin Pharmacol 61: 165-167. doi:10.1007/s00228-005-0894-9. PubMed: 15761753. - DOI - PubMed
    1. Watts G (2007) WHO launches campaign to make drugs safer for children. BMJ 335: 1227. doi:10.1136/bmj.39423.581042.DB. PubMed: 18079526. - DOI - PMC - PubMed
    1. Cox ER, Halloran DR, Homan SM, Welliver S, Mager DE (2008) Trends in the Prevalence of Chronic Medication Use in Children: 2002–2005. Pediatrics 122: e1053-e1061. doi:10.1542/peds.2008-0214. PubMed: 18977954. - DOI - PubMed

Publication types