

Targeting endothelial junctional adhesion molecule-A/ EPAC/ Rap-1 axis as a novel strategy to increase stem cell engraftment in dystrophic muscles
- PMID: 24378569
- PMCID: PMC3927958
- DOI: 10.1002/emmm.201302520
Targeting endothelial junctional adhesion molecule-A/ EPAC/ Rap-1 axis as a novel strategy to increase stem cell engraftment in dystrophic muscles
Abstract
Muscular dystrophies are severe genetic diseases for which no efficacious therapies exist. Experimental clinical treatments include intra-arterial administration of vessel-associated stem cells, called mesoangioblasts (MABs). However, one of the limitations of this approach is the relatively low number of cells that engraft the diseased tissue, due, at least in part, to the sub-optimal efficiency of extravasation, whose mechanisms for MAB are unknown. Leukocytes emigrate into the inflamed tissues by crossing endothelial cell-to-cell junctions and junctional proteins direct and control leukocyte diapedesis. Here, we identify the endothelial junctional protein JAM-A as a key regulator of MAB extravasation. We show that JAM-A gene inactivation and JAM-A blocking antibodies strongly enhance MAB engraftment in dystrophic muscle. In the absence of JAM-A, the exchange factors EPAC-1 and 2 are down-regulated, which prevents the activation of the small GTPase Rap-1. As a consequence, junction tightening is reduced, allowing MAB diapedesis. Notably, pharmacological inhibition of Rap-1 increases MAB engraftment in dystrophic muscle, which results into a significant improvement of muscle function offering a novel strategy for stem cell-based therapies.
Figures
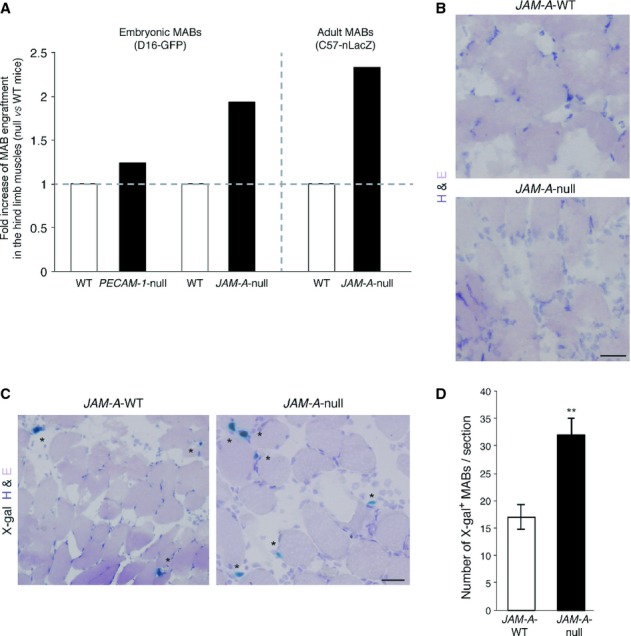
D16-GFP embryonic or C57-nLacZ adult murine mesoangioblasts (MABs) were injected into the right femoral artery of WT, PECAM-1-null and JAM-A-null age-matched mice (treated with cardiotoxin 24 h before transplantation) as indicated. After 6 h, the hind limb muscles (gastrocnemius, tibialis anterior and quadriceps) were collected and the presence of migrated cells was quantified using qRT-PCR with GFP or nLacZ primers. The RNA levels were normalized using GAPDH. The RNA relative levels for the controls were set to 1, and the ratios for PECAM-1-null ( n = 7) or JAM-A-null ( n = 10) versus WT ( n = 17) are shown for embryonic (left) and adult (right) murine MABs. Fold increases have been extrapolated by data shown in Figure S1A–E.
Representative Hematoxilin and Eosin (H&E) staining of JAM-A-WT and JAM-A-null mice from A after cardiotoxin treatment. Scale bars: 50 μm.
Representative cryosections of the gastrocnemius muscle of JAM-A-WT and JAM-A-null mice stained for with H&E and X-gal. Asterisks indicate donor cells. Scale bars: 50 μm.
Quantification of X-gal+ MABs in cryosections illustrated in C. ** P < 0.05. Data are expressed as means ± s.e.m.
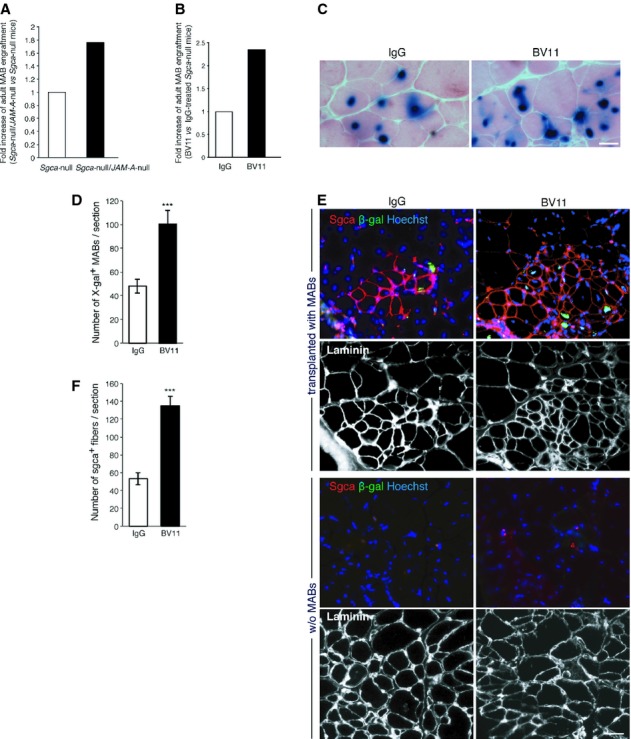
Adult MABs were injected into the right femoral artery of Sgca-null and Sgca-null/ JAM-A-null mice. After 6 h, the hind limb muscles (gastrocnemius, tibialis anterior and quadriceps) were collected and the presence of migrated cells was quantified using qRT-PCR with nLacZ primers. The nLacZ RNA relative level (normalized to GAPDH expression) obtained for controls was set to 1, and the ratios for Sgca-null/ JAM-A-null ( n = 8) versus control mice ( Sgca-null, n = 6) is shown. Fold increase has been extrapolated by data shown in Figure S1F.
Sgca-null mice were treated with a JAM-A neutralizing antibody (BV11, 3 mg/kg) or with non-related IgG (IgG, 3 mg/kg) as control. After 1 h, the mice were intra-arterially transplanted with adult MABs and 6 h later the muscles were collected and processed as described in A. nLacZ RNA relative levels obtained for the controls was set to 1, and the ratio for BV11 versus control (IgG) is shown. Fold increase has been extrapolated by data shown in Figure S1G.
BV11 ( n = 3) or IgG ( n = 3) were given to Sgca-null/scid/beige mice as described in B. Three weeks after the C57-nLacZ intra-arterial transplantations, the muscles were analyzed and representative cryosections of the gastrocnemius muscle stained for eosin and X-gal are shown. Scale bar: 40 μm.
Quantification of the number of X-gal+ MABs in gastrocnemius cryosections. Scale bar: 40 μm. *** P < 0.001.
Immunofluorescence staining of Sgca (red), β-galactosidase (β-gal, green), Hoechst (blue) and laminin (white, lower images of both panels) were performed on sections adjacent to those shown in C (transplanted with MABs) and on contralateral not transplanted muscles (w/o MABs) as a control. Merged images of red, green and blue signals are shown (upper images of both panels). Scale bar: 80 μm.
Quantification of Sgca+ fibers shown in E, upper panel (transplanted with MABs). *** P < 0.0001. Data are expressed as means ± s.e.m.

Endothelial cells isolated from JAM-A-WT (left) and JAM-A-null (right) mice were seeded onto glutaraldehyde-crosslinked gelatin-coated filters (Transwell). 6-carboxyfluorescin diacetate (6-CFDA)-labeled embryonic (top) and adult (bottom) MABs were added to the upper chamber and allowed to migrate for 6 h. The migrated MABs (green) on the lower sides of the filters were fixed and counted. A representative experiment of five independent experiments, each in triplicate, is shown. Scale bar: 100 μm.
Quantification of the number of migrated MABs per area, as illustrated in A. ** P < 0.001. Data are means ± s.e.m. from five independent experiments, each in triplicate.
As in A, except that JAM-A-WT endothelial cells were pre-treated (3 h) and further incubated (6 h) with vehicle, non-related IgG and BV11 (20 μg/ml) (left and middle, respectively). JAM-A-null endothelial cells were also incubated with vehicle (right) as a further internal control, illustrating that increased MAB transmigration due to acute inhibition of JAM-A is comparable with their capacity to migrate in the absence of JAM-A. Representative experiment of four independent experiments carried out in triplicate. Scale bars: 100 μm.
Quantification of migrated embryonic MABs through JAM-A-WT (white and black bars) and JAM-A-null (grey bar) endothelial cells per area, as illustrated in C. ** P < 0.001. Data are means ± s.e.m. from four independent experiments, each in triplicate.
6-CFDA-labelled embryonic (left) and adult (right) MABs were incubated with non-related IgGs (white bars), BV11 (20 μg/ml), (black bars) for 3 h. Then the MABs were seeded on filters and allowed to migrate for a further 3 h in the presence of the indicated agents. The migrated MABs on the lower side of the filters (green) were fixed and counted. Quantification of migrated cells per area is shown. Data are means ± s.e.m. from three independent experiments, each in triplicate.
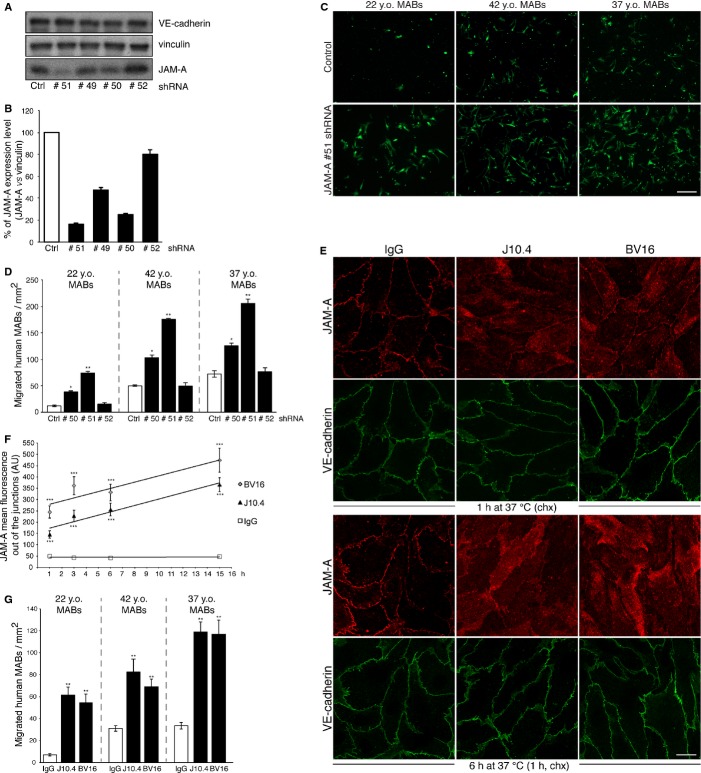
HUVECs with stable scrambled shRNA (Ctrl) or JAM-A targeting shRNAs (#51, #49, #50, #52) were generated (see Materials and Methods) and then homogenized. The cell lysates were analyzed by immunoblotting for JAM-A and VE-cadherin, using vinculin as loading control.
Quantification of data presented in A. JAM-A expression levels were normalized with vinculin and are expressed as percentages. Data are means ± s.d. from three independent experiments.
HUVECs with stable scrambled shRNA (ctrl) or a JAM-A targeting shRNA (#51) were seeded onto Transwell filters for 72 h. 6-CFDA-labeled human MABs derived from three different donors (22-, 42-and 37-year old [y.o.] healthy donors) were added to the upper chamber and allowed to migrate for 8 h. Migrated MABs on the lower sides of the filters (green) were fixed and counted. Representative data are shown from four independent experiments, each in triplicate. Scale bar: 100 μm.
Quantification of migrated MABs per area is shown for 22 y.o. (left), 42 y.o. (middle) and 37 y.o. (right) MABs. * P < 0.01, ** P < 0.001. Data are means ± s.e.m. from four independent experiments, each in triplicate.
Confluent monolayers of HUVECs were treated with non-related IgG, J10.4 and BV16 (12 μg/ml) at 37°C, for the indicated times. The cells were then incubated for the last 1 h with 100 μg/ml cycloheximide (chx) to inhibit protein synthesis, fixed and stained for JAM-A (red) and VE-cadherin (marker for junctions, green). Scale bar: 20 μm.
Quantification of JAM-A delocalization. Time course (1, 3, 6 and 15 h) for mean fluorescence (expressed in arbitrary units, AU, in cells treated with IgG, J10.4 and BV16, as indicated). The trend lines are shown. *** P < 0.00001 compared with IgG. Data are means ± s.e.m. from three independent experiments.
Experiments performed as in C, except the HUVECs were pre-treated (3 h) and further incubated (8 h) with non-related IgG, J10.4 and BV16 (as indicated). Quantification of migrated MABs per area is shown for 22 y.o. (left), 42 y.o. (middle) and 37 y.o. (right) MABs. ** P < 0.001. Data are means ± s.e.m. from three independent experiments, each in triplicate.
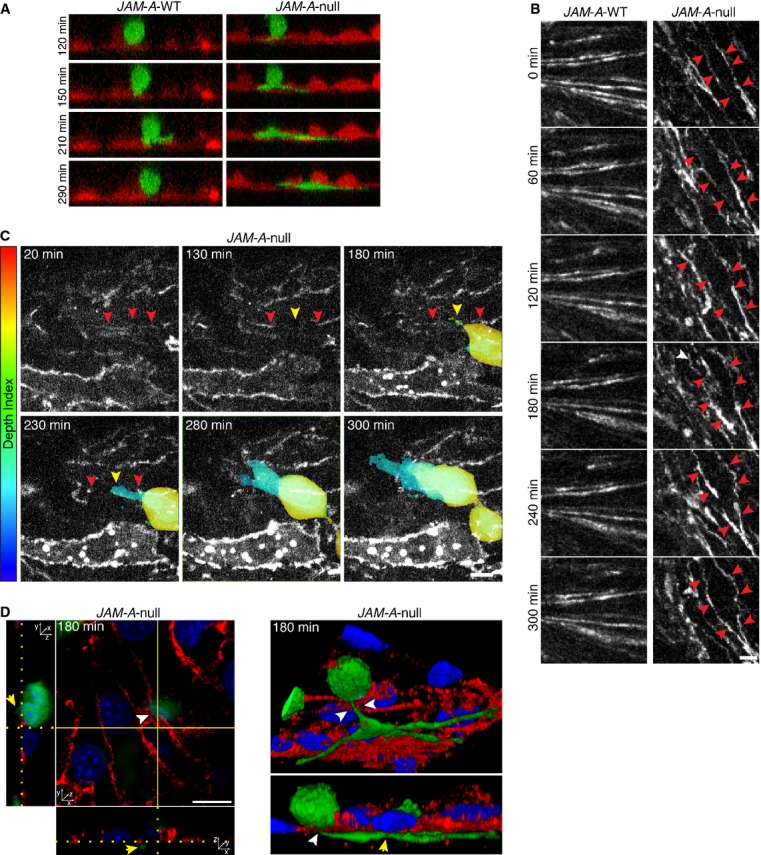
Time-lapse imaging of adult MAB (C57-GFP, green) transmigration across JAM-A-WT (left, red) and JAM-A-null (right, red) endothelial cells expressing Td-tomato seeded onto collagen matrix. Images stack were obtained every 7 min from 0 (time of MAB addition to the endothelial monolayers) to 380 min. Representative time frame images (120, 150, 210 and 290 min) from stack projection along y-axis are shown. See also supplementary Fig S5G and Movie S1.
Time-lapse imaging of JAM-A-WT (left) and JAM-A-null (right) endothelial cells expressing PECAM-1-GFP as marker of cell-cell junction (white). Images stack were obtained every 12 min for 300 min. Representative time frame images (0, 60, 120, 180, 240 and 300 min) are shown. The red arrowheads indicated the junction dynamics. Scale bar: 10 μm. See also supplementary Movie S2.
Time-lapse imaging of C57-GFP MAB transmigration across JAM-A-null endothelial cells expressing PECAM-1-GFP (white) seeded onto collagen matrix. Images stack were obtained every 10 min for 300 min. Representative time frame images (20, 130, 180, 230, 280, 300 min) are shown. MAB is shown as a gradient of pseudo-colors (Depth index) ranging from red (top, on the endothelium) to blue (bottom, through the collagen matrix), varying according to focal plane depth. The red arrowheads indicated the junctions. The yellow arrowhead highlights the crossing point of MAB through the disrupted junctions. Scale bar: 10 μm. See also supplementary Movie S3.
Time course of C57-GFP MAB transmigration across JAM-A-null endothelial cells seeded onto collagen matrix. JAM-A-null endothelial cells were fixed at different time point during the transmigration assay and then stained with anti-PECAM-1 (red) as marker of cell-cell junction and DAPI (blue) as marker of nuclei. Two representations of a confocal z-stack taken after 180 min of MAB transmigration are shown. On the left, orthogonal cross-sections and on the right, a couple of images taken from a 3D reconstruction are shown. The white arrowhead (top) indicated the crossing point of MABs through the disorganized junctions. The yellow arrowheads highlighted the portion of MAB under the endothelium. Scale bar: 10 μm.

Cultured endothelial cells isolated from JAM-A-WT and JAM-A-null mice were homogenized. The lysates were analyzed by immunoblotting for EPAC-1, EPAC-2 and JAM-A using vinculin as a loading control.
JAM-A-WT endothelial cells were incubated with IgG or BV11 (20 μg/ml) for the indicated times and then treated as in A, except we used GAPDH as the loading control. Representative experiment of three independent experiments is shown.
Confluent monolayers of JAM-A-WT and JAM-A-null endothelial cells were harvested in lysis buffer. The protein extracts were incubated with the Ral-GDS-RBD probe or the GST-negative control (as indicated). The active Rap-1 (Rap-1-GTP) and total Rap-1 were detected using an anti-Rap-1 antibody. Representative data are shown for the densitometry analysis of active Rap-1-GTP, normalized for total protein. ** P < 0.001 versus JAM-A-WT. Data are means ± s.d. from three independent experiments.
JAM-A-WT endothelial cells were incubated with IgG or BV11 for 3 h and 6 h (as indicated). Rap1-GTP loading quantified by GST pull-down/ Western blotting and densitometry analysis, as reported in C. Data are means ± s.d. from three independent experiments.
Confluent monolayers of JAM-A-WT and JAM-A-null endothelial cells were fixed and double-stained with anti-VE-cadherin (green, left) as marker of cell-cell junction and GST-RalGDS-RBD (white) to detect the Rap-1-GTP (right). The insets show high magnification fields of VE-cadherin (white, dashed square) and Rap-1-GTP (red, dashed square) stainings. The arrowheads indicated the junctions. Pixels representing the co-localization of Rap-1-GTP with VE-cadherin are highlighted in yellow. Scale bar: 20 μm.
Rap-1-GTP immunofluorescence intensity at junctions is expressed as arbitrary units (AU). ** P < 0.02. Data are means ± s.e.m. from three independent experiments.
Cultured JAM-A-WT endothelial cells were homogenized, and the lysates (Input) were subjected to immunoprecipitation (IP) using an anti-JAM-A monoclonal antibody or IgG, as control. Precipitated material was analyzed by immunoblotting for JAM-A, afadin, EPAC-1, EPAC-2 and Rap-1. Representative experiment of three independent experiments is shown.
As in G, except the lysates (Input) were subjected to immunoprecipitation (IP) using an anti-EPAC-2 antibody or IgG, as control. Precipitated material was analyzed by immunoblotting for JAM-A, EPAC-1 and EPAC-2. Representative experiment of three independent experiments is shown.

JAM-A-WT endothelial cells were starved for 16 h and then treated with vehicle (ctrl), a selective activator of EPAC (007, 100 μM) or tetradecanoylphorbol acetate (TPA, 10 μM), an activator of the signal transduction enzyme protein kinase C, used as positive control for Rap-1 activation. Rap1-GTP loading was quantified by GST pull-down/ Western blotting and densitometry analysis. Representative blot (left) and quantification of densitometry analysis (right) of Rap-1-GTP levels normalized for total amount of protein. ** P < 0.001. Data are means ± s.d. from three independent experiments.
JAM-A-WT endothelial cells were incubated with the Rap-1 pharmacological inhibitor GGTI-298 (10 μM) or vehicle for 3 h and 6 h (as indicated). Rap1-GTP loading was quantified as in A. Data are means ± s.d. from three independent experiments. Note: to highlight Rap-1 activation, the filter in A was exposed for 30 s, while in B it was exposed for 5 min, to improve the evaluation of Rap-1 inhibition at 3 h and 6 h.
JAM-A-WT and JAM-A-null endothelial cells seeded on coated filters for 72 h and treated with vehicle (ctrl) or 007 or GGTI-298 for the last 30 min, as indicated. 6-CFDA-labelled adult MABs were added to the upper chamber and allowed to migrate for 6 h under these conditions. Quantification of migrated MABs per area for JAM-A-WT (on the left of the dashed line) and JAM-A-null (on the right of the dashed line) endothelial cells. ** P < 0.001. Data are means ± s.e.m. from three independent experiments, each in triplicate.
6-CFDA-labelled embryonic (left) and adult (right) MABs were incubated with vehicle (ctrl, white bars), 007 (100 μM) or GGTI-298 (10 μM) (black bars) for 3 h, as indicated. Then the MABs were seeded on filters and allowed to migrate for a further 3 h in the presence of the indicated agents. The migrated MABs on the lower side of the filters (green) were fixed and counted. Quantification of migrated cells per area is shown. Data are means ± s.e.m. from three independent experiments, each in triplicate.
HUVECs were treated as described in C. Quantification of migrated MABs per area is shown for 22 y.o. (left), 42 y.o. (middle) and 37 y.o. (right) MABs. ** P < 0.001. Data are means ± s.e.m. from three independent experiments, each in triplicate.
Sgca-null mice were treated with GGTI-298 (50 mg/Kg, n = 2) or with vehicle (ctrl, n = 3) for 1 h and then were intra-arterially transplanted with adult MABs. After 6 h, the hind limb muscles were collected and the presence of migrated cells was quantified using qRT-PCR with nLacZ primers. The relative RNA level of nLacZ obtained for control was set to 1, and the ratio for GGTI-298 versus control is shown. Fold increases have been extrapolated by data shown in Figure S1H.
Box-plot showing exercise tolerance in a treadmill test for untreated Sgca-null/scid/beige mice, Sgca-null/scid/beige mice transplanted with MABs (+ MABs, 5 × 10⁵ cells injected bilaterally in femoral arteries) and Sgca-null/scid/beige mice transplanted with MABs and treated with GGTI-298 (+MABs + GGTI-298, 5 × 10⁵ cells injected bilaterally in femoral arteries). Values are plotted as fold increase of motor capacity measured at different time points (21, 28 and 35 days post transplantation), and were normalized with the baseline performances of each mouse. Data are means ± s.e.m. of 3 mice per group. ** P < 0.01, *** P < 0.001, one-way ANOVA.
References
-
- Arechavala-Gomeza V, Anthony K, Morgan J, Muntoni F. Antisense oligonucleotide-mediated exon skipping for duchenne muscular dystrophy: progress and challenges. Curr Gene Ther. 2012;12:152–160. - PubMed
-
- Ashkar S, Weber GF, Panoutsakopoulou V, Sanchirico ME, Jansson M, Zawaideh S, Rittling SR, Denhardt DT, Glimcher MJ, Cantor H. Eta-1 (osteopontin): an early component of type-1 (cell-mediated) immunity. Science. 2000;287:860–864. - PubMed
-
- Bauer K, Mierke C, Behrens J. Expression profiling reveals genes associated with transendothelial migration of tumor cells: a functional role for alphavbeta3 integrin. Int J Cancer. 2007;121:1910–1918. - PubMed
-
- Bazzoni G, Dejana E. Endothelial cell-to-cell junctions: molecular organization and role in vascular homeostasis. Physiol Rev. 2004;84:869–901. - PubMed
-
- Bazzoni G, Martinez-Estrada OM, Orsenigo F, Cordenonsi M, Citi S, Dejana E. Interaction of junctional adhesion molecule with the tight junction components ZO-1, cingulin, and occludin. J Biol Chem. 2000;275:20520–20526. - PubMed
Publication types
MeSH terms
Substances
Grants and funding
LinkOut - more resources
Full Text Sources
Other Literature Sources
Medical
Research Materials
