. 2014 Feb 1;192(3):906-18.
doi: 10.4049/jimmunol.1302112. Epub 2013 Dec 30.

Neutrophil-mediated IFN activation in the bone marrow alters B cell development in human and murine systemic lupus erythematosus

Affiliations

Neutrophil-mediated IFN activation in the bone marrow alters B cell development in human and murine systemic lupus erythematosus

Arumugam Palanichamy et al. J Immunol. .

Abstract

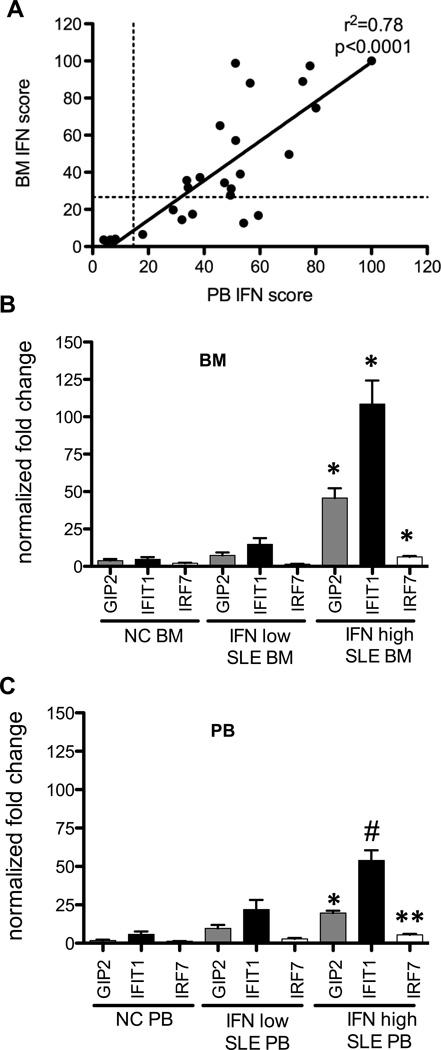
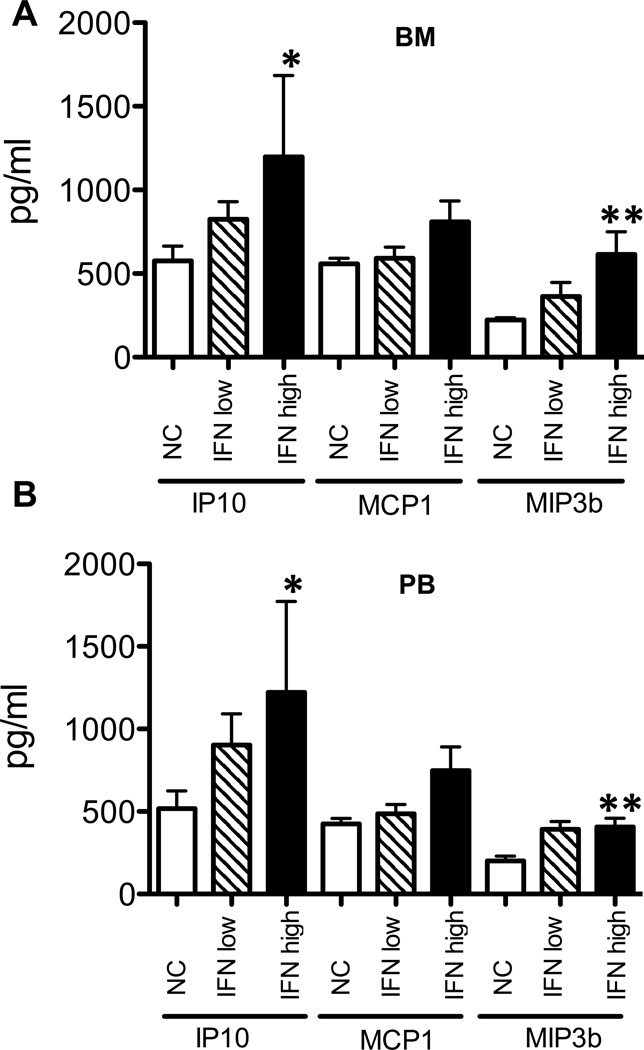
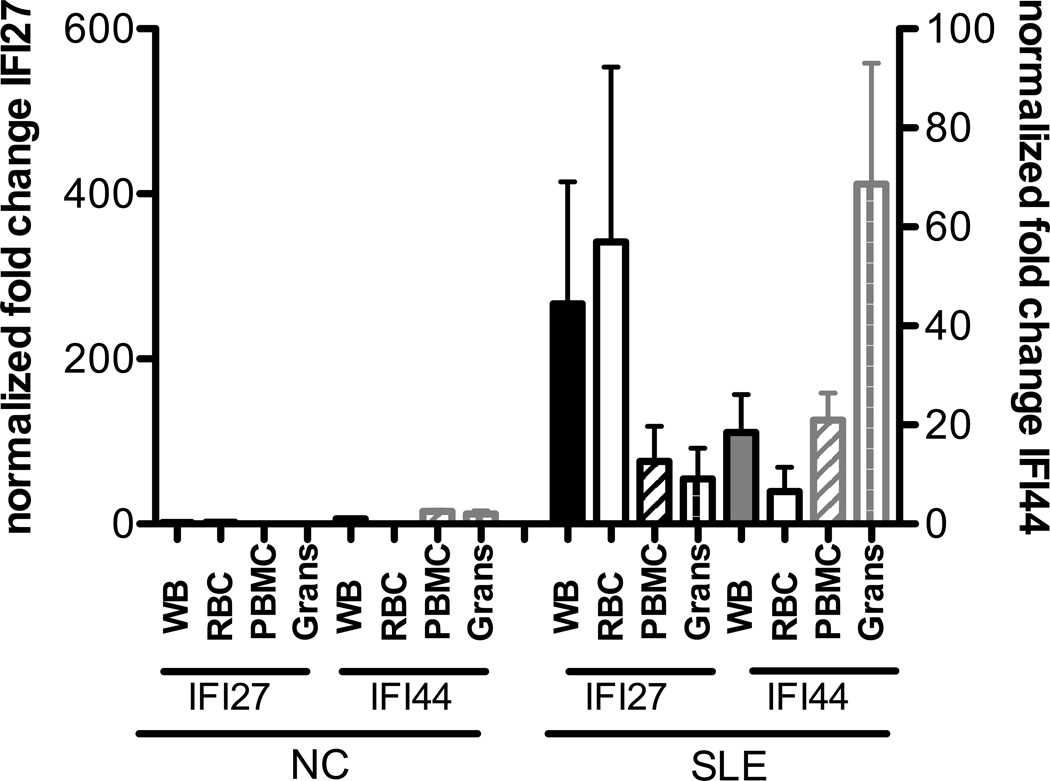
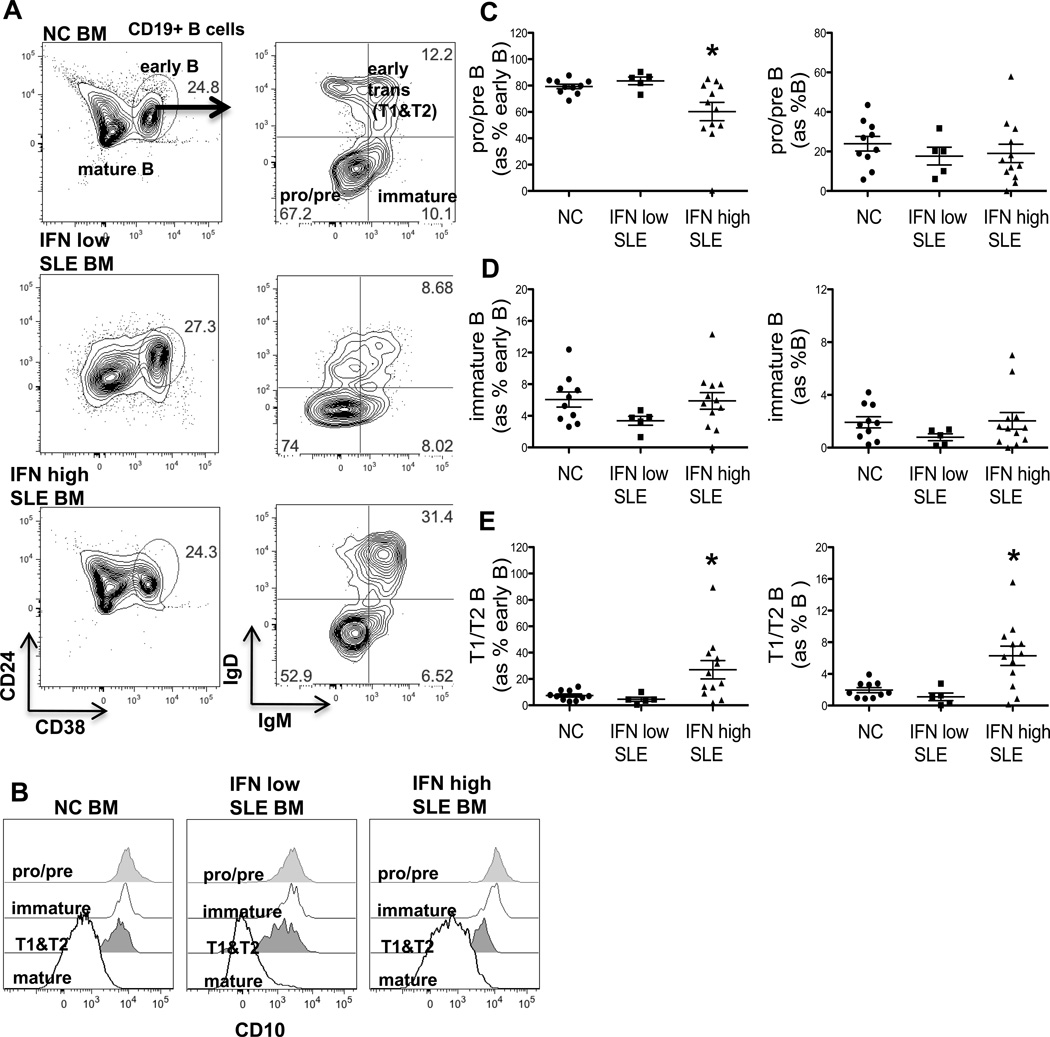
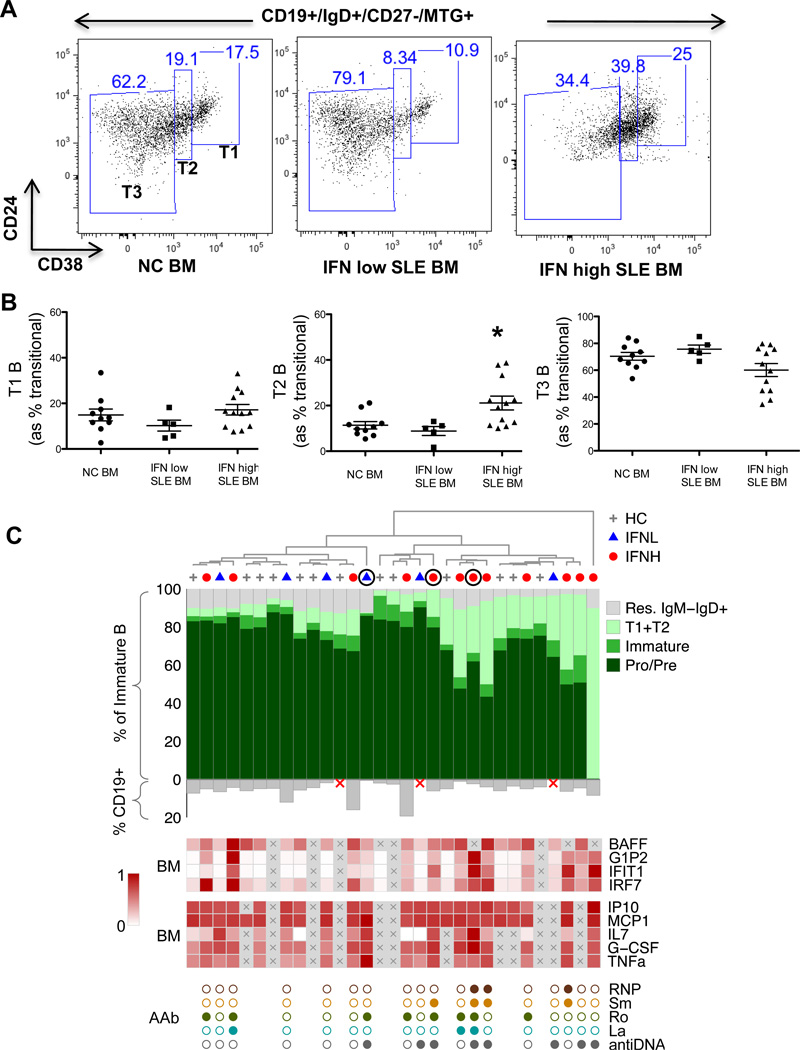
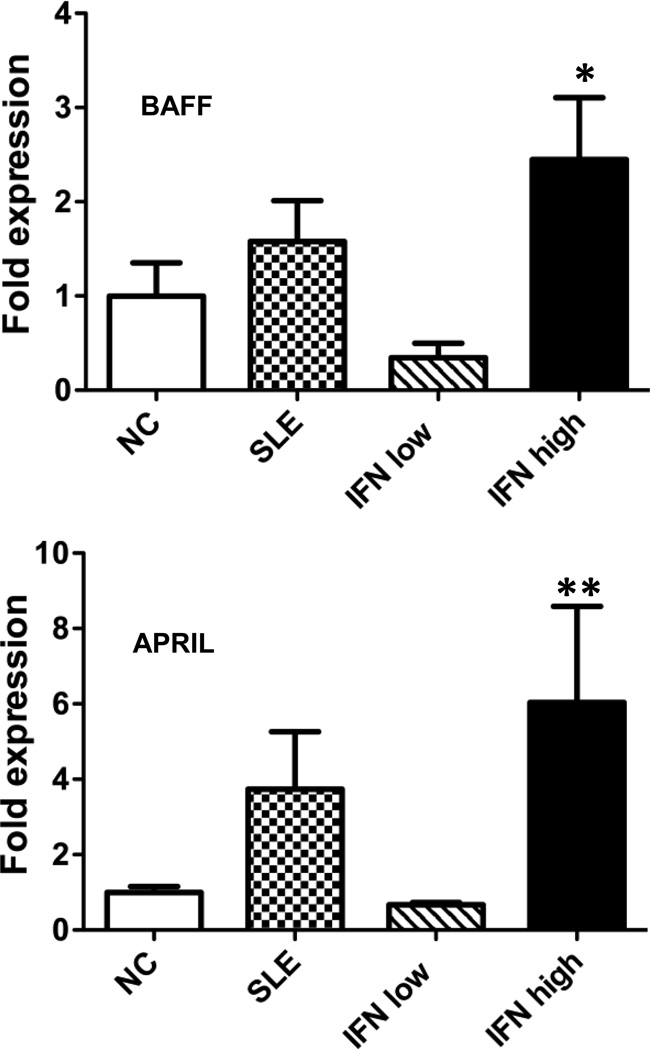
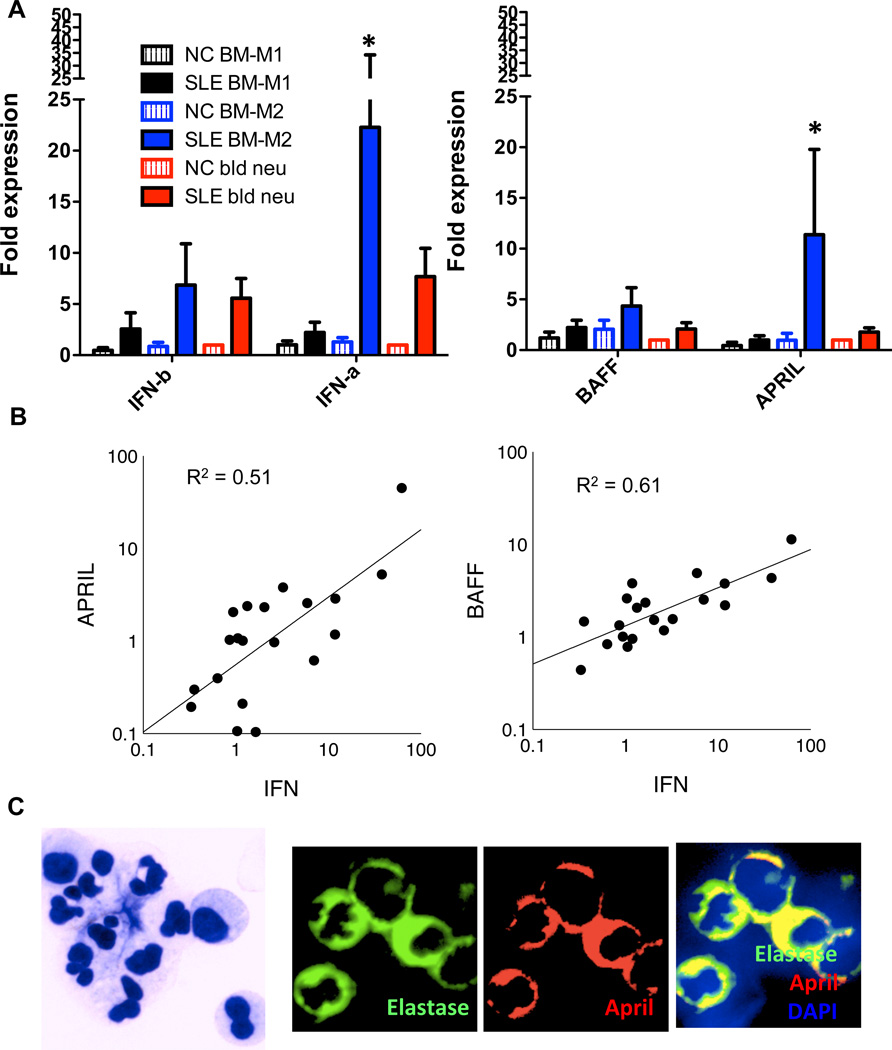
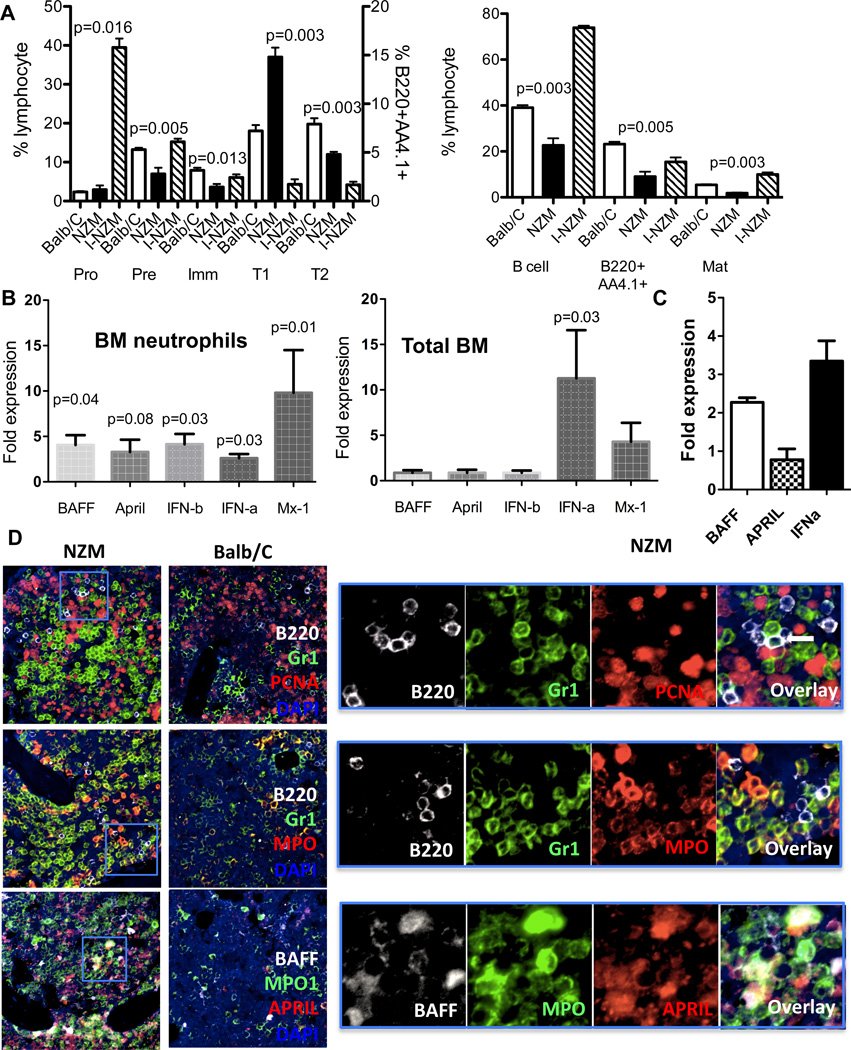
Inappropriate activation of type I IFN plays a key role in the pathogenesis of autoimmune disease, including systemic lupus erythematosus (SLE). In this study, we report the presence of IFN activation in SLE bone marrow (BM), as measured by an IFN gene signature, increased IFN regulated chemokines, and direct production of IFN by BM-resident cells, associated with profound changes in B cell development. The majority of SLE patients had an IFN signature in the BM that was more pronounced than the paired peripheral blood and correlated with both higher autoantibodies and disease activity. Pronounced alterations in B cell development were noted in SLE in the presence of an IFN signature with a reduction in the fraction of pro/pre-B cells, suggesting an inhibition in early B cell development and an expansion of B cells at the transitional stage. These B cell changes strongly correlated with an increase in BAFF and APRIL expression in the IFN-high BM. Furthermore, we found that BM neutrophils in SLE were prime producers of IFN-α and B cell factors. In NZM lupus-prone mice, similar changes in B cell development were observed and mediated by IFN, given abrogation in NZM mice lacking type-I IFNR. BM neutrophils were abundant, responsive to, and producers of IFN, in close proximity to B cells. These results indicate that the BM is an important but previously unrecognized target organ in SLE with neutrophil-mediated IFN activation and alterations in B cell ontogeny and selection.


Conflict of interest statement

Conflict of Interest: JWB is a current employee of UCB. RD is an employee of XDx. The other authors have no conflicts of interest to report.

Figures

Fig 1
Fig 1. IFN signature in the bone marrow of SLE patients
IFN signature was measured in terms of relative expression of the 3 IFN inducible genes GIP2, IFIT1 and IRF7 (which was shown to reflect the microarray gene expression technology) normalized to a house keeping gene (GAPDH) and using a healthy control blood sample that was included in each run, and (for BM) re-calibrated against a healthy BM. IFN score (summation of scores of all 3 genes) in the SLE PB correlated significantly with the BM with a R2=0.78, P<0.0001 (n=26) (Spearman’s correlation). SLE patients were divided into IFN high (n=16) and IFN low (n=12) groups based on the BM IFN scores (IFN high group: IFN score >2 SD above the normal mean) (n=20 NC). Dotted lines show the cut off between IFN high and IFN low groups in BM and PBL as determined from the IFN score (A). Fold change of individual IFN inducible genes in IFN high and IFN low SLE groups are shown in B (BM) and C (PB) respectively (±SEM). IFN high SLE patients expressed significantly higher levels of all 3 IFN inducible genes compared to NC and IFN low SLE patients. *p<0.0001 for 3-group comparison (Kruskal-Wallis) with significance on IFN high compared to NC and IFN low (BM) (post-hoc Dunn’s test) and p=0.0003 for 3-group comparison with significance on IFN high compared to NC and IFN low (PB). #represents p=0.0008; **p=0.0004 (Kruskal-Wallis 3-group comparison with significance maintained in high vs. NC and high vs low on Dunn’s multiple comparison test).
Fig 2
Fig 2. IFN regulated chemokines are upregulated in SLE BM with an IFN signature
IFN regulated chemokines IP-10 (CXCL10), MCP1 (CCL2) and MIP3b (CCL19) were assessed in BM supernatant (A) and peripheral blood serum or plasma (B) in NC (n=23) and SLE patients with low (n=12) or high (n=16) IFN signatures as defined in Figure 1 (mean±SEM). *p=0.012 for 3-group comparison (Kruskal-Wallis) (BM) and 0.042 (PB) with significance on IFN high and IFN low compared to NC (post-hoc Dunn’s test). **p=0.004 (BM) and p=0.008 (PB) for 3-group comparison with significance on IFN high compared to NC.
Fig 3
Fig 3. IFN signature in SLE RBCs reflects erythropoiesis in an IFN rich BM environment
Red blood cells (RBC), PBMCs, and granulocytes (Grans) were purified as described in the methods, RNA prepared, and the expression of two IFN regulated genes IFI27 and IFI44 measured. Gene expression in IFN high SLE patients (n=5) and healthy controls (NC) (n=3) is represented relative to the average expression level in whole blood (WB) from NC after normalization to house keeping genes. All SLE values are significantly different p=0.03 compared to NC (mean±SEM) (except for IFI27 in granulocytes) (Mann-Whitney).
Fig 4
Fig 4. Abnormalities in early B cell development in SLE bone marrow with an IFN signature
A) Flow cytometric analysis of CD19+ BM cells separates B cells into early (CD24+++, CD38+++ expression) versus mature (excluding CD24+++, CD38+++) populations. Early B cells were further divided into pro/pre, immature and early transitional (T1&T2) B cells based on the expression of IgD and IgM. IFN high lupus patients exhibit reduced pro/pre B cells and elevated early transitional T1&T2 cells compared to NC and IFN low SLE. Representative examples of this phenomenon are shown in (A). (B) B cell precursors express high levels of CD10. (C) Pro/pre B cells are expressed as a fraction of CD24/CD38 high early B cells (left) or total B cells (right) and are significantly decreased in the IFN high group. (D) Immature B cell and (E) early transitional (T1/T2) fractions are shown. Transitional B cells are increased in the IFN high BMs. *p=0.012 for 3-group comparison (Kruskal-Wallis) with significance on IFN high compared to IFN low (post-hoc Dunn’s test).
Fig 5
Fig 5. Modulation of transitional B cell compartment in SLE BM with an IFN signature
CD19+, IgD+, CD27− naive B cells were examined for mitotracker G (MTG) retaining transitional B cells. These cells were further divided into transitional B cell subsets T1, T2 and T3 based on the relative expression of CD24 and CD38 markers. Representative examples of distribution of transitional B cells in the NC BM, IFN low SLE BM and IFN high SLE BM are shown in (A). Representation of transitional subsets as fraction of total transitional B cells is shown in (B). SLE BM with an IFN signature consisted of significantly higher fractions of transitional type 2 (T2) B cells in the transitional compartment * represents p≤0.01 compared to NC and IFN low SLE BM). *p=0.007 for 3-group comparison (Kruskal-Wallis) with significance on IFN high compared to IFN low and NC (post-hoc Dunn’s test). (C) Cluster analysis reveals a correlation between Pro/Pre contraction and T1/T2 expansion in the BM (Spearman coefficient −0.93, p<0.0001). The stacked-bar plot represents the relative proportions of the early B cell subsets (CD24CD38 high). Samples were clustered (by flow data) based on simplicial distance and complete linkage. Sample group is shown by symbols below the dendrogram. High SLEDAI (> 4) is indicated by a circled group label. IFN signature gene expression for bone marrow (BM) is shown as heat maps below the CD19 plot. Responses for each gene (shown for BM) were scaled based on its maximum. ‘X’ indicates missing data. Similarly, log10 chemokine expression in bone marrow is displayed, also scaled to the maximum. Presence/absence of autoantibodies are indicated with closed/open circles, respectively, underneath the gene expression data. IFN high SLE samples cluster together to the right with high transitional (Spearman coefficient 0.40, p=0.043) and contracted pro/pre B cells (Spearman coefficient −0.44, p=0.025) and more autoantibodies (Spearman coefficient 0.61, p=0.001). There is also a correlation between BAFF and contracted pre/pro (p=0.016), expanded T1/T2 (p=0.05), and IFN signature (p<0.0001).
Fig 6
Fig 6. BAFF and APRIL are up-regulated in SLE IFN high BM
BAFF (left) and APRIL (right) mRNA was measured by qPCR in the total BM aspirate in NC (n=24) and SLE (n=26). Expression was normalized to the housekeeping gene GAPDH and then to the normal control samples (mean±SEM). SLE patients were divided into IFN high and IFN low groups based on the BM IFN scores as in Figure 1. *p<0.0001 for 3-group comparison (Kruskal-Wallis) with significance on IFN high compared to NC and IFN low (BM) (p<0.005 and 0.0005 respectively, post-hoc Dunn’s test). **p=0.0009 for 3-group comparison (Kruskal-Wallis) with significance on IFN high compared to NC and IFN low (BM) (p<0.005 in both cases, post-hoc Dunn’s test).
Fig 7
Fig 7. Neutrophils in SLE BM produce increased levels of IFNα and APRIL
(A) Neutrophils were isolated from BM as described in the Materials and Methods for SLE and healthy controls (n=8). IFNα was measured by qPCR and compared to IFNβ. APRIL and BAFF were also measured. Expression was normalized to the housekeeping gene GAPDH and then to the control peripheral blood neutrophils (mean±SEM). *p=0.036 compared to matched healthy control population (Mann-Whitney). (B) Linear regression analysis of the relationship of IFNα RNA levels and APRIL or BAFF RNA levels in the BM cell populations in A plotted on a log scale. (C) Giemsa staining (40× original, cropped for higher magnification) demonstrating purity and morphology of isolated neutrophils from the BM. By immunofluorescence (20× original, cropped for higher magnification) BM neutrophils (green elastase +) express APRIL (red) protein (overlay yellow) (representative of 2 experiments).
Fig 8
Fig 8. Murine SLE is associated with disturbances in B cell lymphopoiesis related to BM IFN activation and driven by neutrophils
(A) NZM mice age 12 wk were compared to age matched NZM mice lacking type I IFN receptor (I-NZM mice) and Balb/C mice (n=5 per group). B cell subsets in the BM were defined as follows: pro (B220lowIgM-CD43+), pre (B220+IgM-CD43low), immature (B220+IgM+CD23−), T1 (B220+AA4.1+IgMhiCD23−), T2 (B220+AA4.1+IgM+CD23+CD24hi), Mature (B220+IgM+CD23+AA4.1-CD24low). Data is shown for B cell subsets expressed relative to the total live lymphocyte gate, except for the T1 and T2 which are expressed relative to the early B cells (AA4.1+). Similar trends were observed when expressed relative to B220+ B cells for all subsets including the T1 and T2. P values were calculated by non-parametric ANOVA (3-group comparison Kruskal-Wallis with post-hoc Dunn’s test). (B) BM and spleen cells (data not shown) were isolated from the above groups of mice (n=7 per group). Neutrophils were isolated from BM as described in the Materials and Methods. IFNα, IFNβ, APRIL, and BAFF were measured by qPCR and expression normalized to the housekeeping gene actin and then to Balb/C controls (mean±SEM). (C) Neutrophils were isolated from lupus prone mouse BM (n=2) and stimulated in vitro with IFNα (1000 units/ml) for 4 hours prior to qPCR. Expression is normalized to housekeeping gene and then to media control cultured neutrophils. (D) Decalcified BM sections were immunostained with antibodies to Gr-1 and MPO (neutrophils), B220 (B cells), PCNA (proliferating cells), APRIL, and BAFF (200× original, images are cropped for size, insets on the right). Neutrophils are prominent in the SLE BM and adjacent to B cells (white arrow). Many BM neutrophils express APRIL, with a smaller fraction co-expressing BAFF. The pictures are representative of 10 different samples from Balb/C and NZM mice.

Similar articles

Cited by

References

    1. Crampton SP, Voynova E, Bolland S. Innate pathways to B-cell activation and tolerance. Annals of the New York Academy of Sciences. 2010;1183:58–68. - PMC - PubMed
    1. Rahman A, Isenberg DA. Systemic lupus erythematosus. The New England journal of medicine. 2008;358:929–939. - PubMed
    1. Baechler EC, Gregersen PK, Behrens TW. The emerging role of interferon in human systemic lupus erythematosus. Current opinion in immunology. 2004;16:801–807. - PubMed
    1. Ronnblom L, Pascual V. The innate immune system in SLE: type I interferons and dendritic cells. Lupus. 2008;17:394–399. - PMC - PubMed
    1. Jego G, Palucka AK, Blanck JP, Chalouni C, Pascual V, Banchereau J. Plasmacytoid dendritic cells induce plasma cell differentiation through type I interferon and interleukin 6. Immunity. 2003;19:225–234. - PubMed

Publication types

MeSH terms