. 2014 Mar;82(3):1181-91.
doi: 10.1128/IAI.01634-13. Epub 2013 Dec 30.

Yersinia pseudotuberculosis efficiently escapes polymorphonuclear neutrophils during early infection

Affiliations

Yersinia pseudotuberculosis efficiently escapes polymorphonuclear neutrophils during early infection

Linda Westermark et al. Infect Immun. 2014 Mar.

Abstract

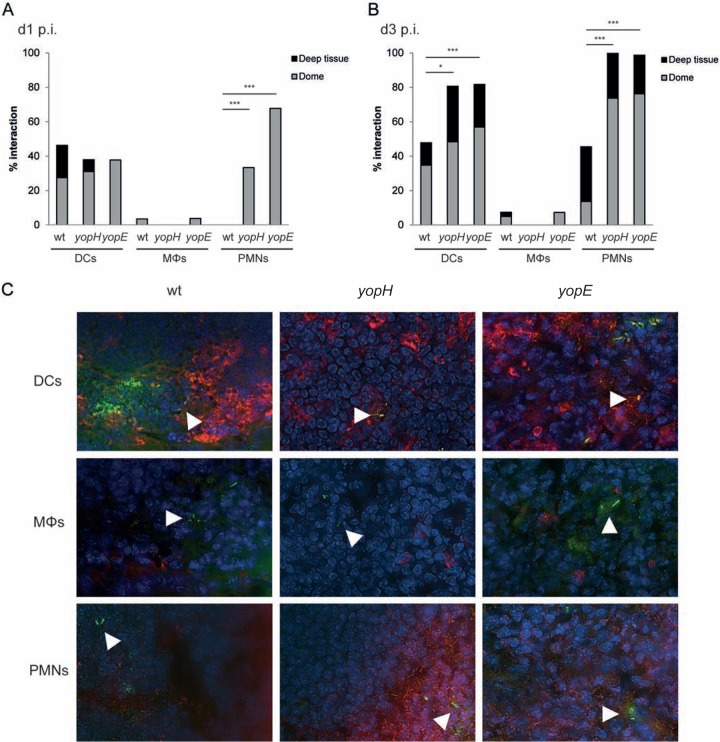
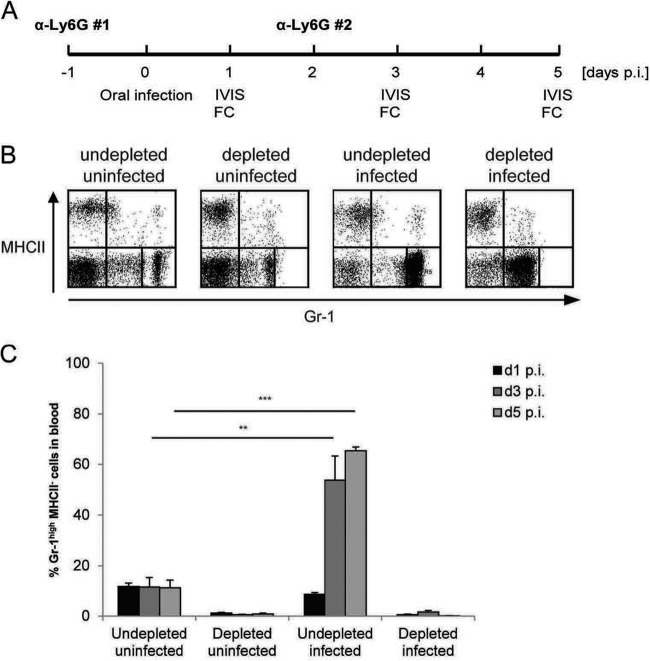
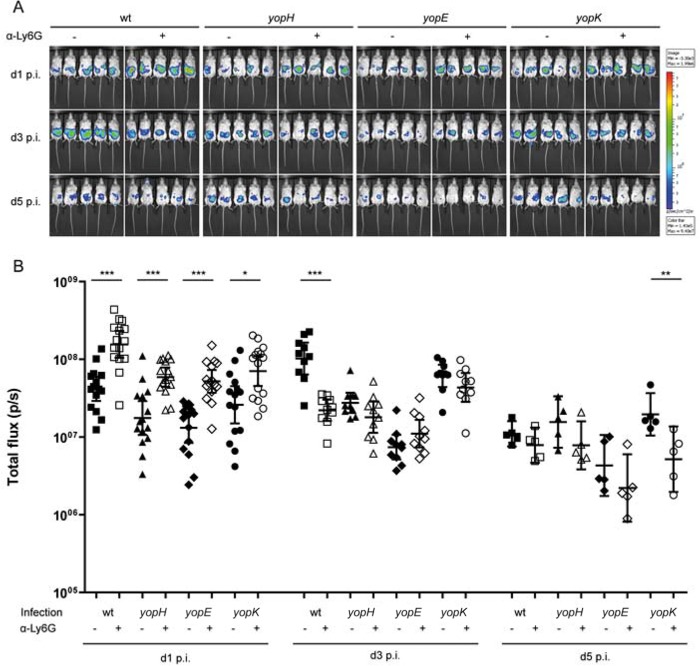
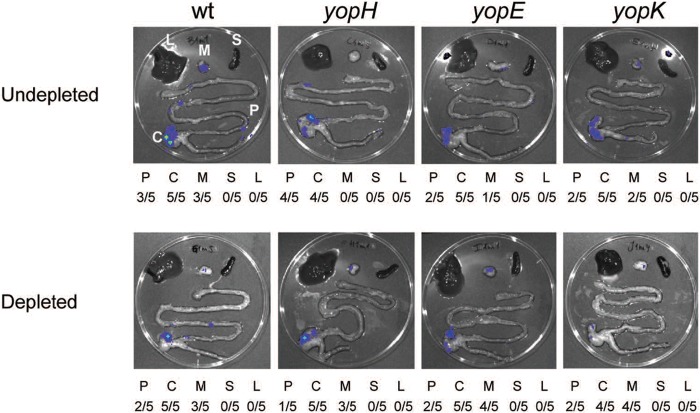
The human-pathogenic species of the Gram-negative genus Yersinia preferentially target and inactivate cells of the innate immune defense, suggesting that this is a critical step by which these bacteria avoid elimination and cause disease. In this study, bacterial interactions with dendritic cells, macrophages, and polymorphonuclear neutrophils (PMNs) in intestinal lymphoid tissues during early Yersinia pseudotuberculosis infection were analyzed. Wild-type bacteria were shown to interact mainly with dendritic cells, but not with PMNs, on day 1 postinfection, while avirulent yopH and yopE mutants interacted with PMNs as well as with dendritic cells. To unravel the role of PMNs during the early phase of infection, we depleted mice of PMNs by using an anti-Ly6G antibody, after which we could see more-efficient initial colonization by the wild-type strain as well as by yopH, yopE, and yopK mutants on day 1 postinfection. Dissemination of yopH, yopE, and yopK mutants from the intestinal compartments to mesenteric lymph nodes was faster in PMN-depleted mice than in undepleted mice, emphasizing the importance of effective targeting of PMNs by these Yersinia outer proteins (Yops). In conclusion, escape from interaction with PMNs due to the action of YopH, YopE, and YopK is a key feature of pathogenic Yersinia species that allows colonization and effective dissemination.


Figures

FIG 1
FIG 1
Avirulent Yop mutants, but not wild-type Y. pseudotuberculosis, interact with PMNs during early infection. BALB/c mice were infected with wt bioluminescent Y. pseudotuberculosis or a yopH or yopE mutant. At 1 and 3 days postinfection, ceca positive for bacterial signals by IVIS were collected. Tissues were cryosectioned and were stained for bacteria in combination with staining for dendritic cells (DCs), macrophages (Mϕs), or neutrophils (PMNs). Stained ceca were analyzed by microscopy, and each bacterium observed was calculated as one event. Bacterial foci were not included in the analysis. (A) Percentage of bacteria interacting with immune cells in the subepithelial dome and the whole lymphoid follicle at day 1 (d1) p.i. Data for wt Y. pseudotuberculosis represent 15 sections per staining from 7 to 8 mice; data for the yopH mutant represent 16 to 21 sections per staining from 8 to 10 mice; and data for the yopE mutant represent 12 to 20 sections per staining from 4 to 7 mice. Differences between groups were analyzed by Fisher's test, with significance set at P values of <0.05 (*), <0.01 (**), or <0.001 (***). (B) Percentage of bacteria interacting with immune cells in the subepithelial dome and the whole lymphoid follicle at day 3 p.i. Data for wt Y. pseudotuberculosis represent 8 to 11 sections per staining from 4 to 5 mice; data for the yopH mutant represent 7 to 9 sections per staining from 4 mice; and data for the yopE mutant represent 4 to 5 sections per staining from 4 to 5 mice. (C) Representative images of bacteria interacting (or not) with DCs, Mϕs, or PMNs in lymphoid follicles of the cecum at day 1 p.i. White arrowheads indicate single bacteria.
FIG 2
FIG 2
Y. pseudotuberculosis infection results in increases in the numbers of Gr-1high MHC-II cells in the blood of undepleted mice but not in the blood of PMN-depleted mice. BALB/c mice were depleted of PMNs by intraperitoneal injections of an anti-Ly6G antibody and were infected with bioluminescent Y. pseudotuberculosis. Mice injected with PBS served as controls. (A) Time line over the experimental setup. IVIS, in vivo imaging system; FC, flow cytometry. (B) Representative dot plots from flow cytometry analysis of PMN depletion, performed on blood from undepleted and depleted uninfected control mice and wt-infected mice. Blood leukocytes were isolated and were analyzed for the expression of Gr-1 and MHC-II. PMNs were identified as Gr-1high MHC-II cells (lower far right quadrants). (C) Flow cytometry analysis of PMN depletion. Blood from undepleted and depleted mice, either uninfected or infected with wt Y. pseudotuberculosis, was collected on days 1, 3, and 5 p.i., and cellular expression of Gr-1 and MHC-II was determined by flow cytometry analysis. Data for gated Gr-1high MHC-II cells are presented as means ± SD. Differences between groups were analyzed by an unpaired Student t test, with significance set at P values of <0.05 (*), <0.01 (**), or <0.001 (***).
FIG 3
FIG 3
PMN depletion results in increased levels of initial bacterial infection. BALB/c mice were depleted of PMNs by intraperitoneal injections of an anti-Ly6G antibody and were infected with wt bioluminescent Y. pseudotuberculosis or with a yopH, yopE, or yopK mutant. Mice injected with PBS served as controls. The infection was monitored and analyzed by IVIS for 5 days. (A) Representative groups of mice followed throughout the infection are shown. The intensity of emission is represented with pseudocolors, with variations in color representing light intensity. Red represents the most intense light emission, while blue corresponds to the weakest signal. (B) Determination of signals at days 1, 3, and 5 p.i. from bioluminescent bacteria in the abdominal sides of BALB/c mice treated with PBS or anti-Ly6G. A total of 15 mice were used for day 1 p.i., 10 for day 3 p.i., and 5 for day 5 p.i., for all groups included. The bacterial signals were measured from sets of regions of interest and are presented as the geometric means of total flux (photons per second per area). Differences between groups were analyzed by the Mann-Whitney U test, with significance set at P values of <0.05 (*), <0.01 (**), or <0.001 (***).
FIG 4
FIG 4
PMN depletion enables faster dissemination of avirulent Yop mutants to MLNs. BALB/c mice were depleted of PMNs by intraperitoneal injections of an anti-Ly6G antibody and were infected with wt bioluminescent Y. pseudotuberculosis or a yopH, yopE, or yopK mutant. Mice injected with PBS served as controls. Bacterial dissemination was determined by dissection of organs and analysis by IVIS at day 1 p.i. Pictures of organs from representative mice are presented together with the numbers of organs positive for bacterial signals by IVIS. P, Peyer's patches; C, cecum; M, mesenteric lymph node; S, spleen; L, liver.
FIG 5
FIG 5
The proportion of Gr-1low MHC-II cells increases in PMN-depleted mice infected with Y. pseudotuberculosis. Blood from undepleted and PMN-depleted mice, uninfected or infected with wt Y. pseudotuberculosis, was collected and was analyzed for the presence of Gr-1+ cells by flow cytometry. (A) Percentages of Gr-1low MHC-II cells during the course of the experiment. Cellular expression of Gr-1 and MHC-II was determined by flow cytometry analysis. Data for gated Gr-1low MHC-II cells are presented as means ± SD. (B) Representative dot plots from flow cytometry analysis performed on blood leukocytes to investigate the distribution of mature and immature PMNs and monocytes upon infection in undepleted and PMN-depleted mice. Blood leukocytes were isolated and were analyzed for the expression of Gr-1 and F4/80. Monocytes were identified as Gr-1+ F4/80+ cells (upper right quadrants), immature PMNs as Gr-1low F4/80 cells (lower middle quadrants), and mature PMNs as Gr-1high F4/80 cells (lower far right quadrants). (C) Different Gr-1+ cell types in blood from undepleted and depleted mice, uninfected or infected with wt Y. pseudotuberculosis, at day 5 postinfection. The flow cytometry analysis used gates to separate Gr-1+ cells into monocytes (Mo), immature neutrophils (iPMNs), and mature neutrophils (mPMNs) on the basis of their expression of Gr-1 and F4/80. Data are presented as means ± SD. Differences between groups were analyzed by an unpaired Student t test, with significance set at P values of <0.05 (*), <0.01 (**), or <0.001 (***).

Similar articles

Cited by

References

    1. Barnes PD, Bergman MA, Mecsas J, Isberg RR. 2006. Yersinia pseudotuberculosis disseminates directly from a replicating bacterial pool in the intestine. J. Exp. Med. 203:1591–1601. 10.1084/jem.20060905 - DOI - PMC - PubMed
    1. Holmström A, Rosqvist R, Wolf-Watz H, Forsberg A. 1995. Virulence plasmid-encoded YopK is essential for Yersinia pseudotuberculosis to cause systemic infection in mice. Infect. Immun. 63:2269–2276 - PMC - PubMed
    1. Trcek J, Berschl K, Trulzsch K. 2010. In vivo analysis of Yersinia enterocolitica infection using luxCDABE. FEMS Microbiol. Lett. 307:201–206. 10.1111/j.1574-6968.2010.01983.x - DOI - PubMed
    1. Simonet M, Richard S, Berche P. 1990. Electron microscopic evidence for in vivo extracellular localization of Yersinia pseudotuberculosis harboring the pYV plasmid. Infect. Immun. 58:841–845 - PMC - PubMed
    1. Logsdon LK, Mecsas J. 2006. The proinflammatory response induced by wild-type Yersinia pseudotuberculosis infection inhibits survival of yop mutants in the gastrointestinal tract and Peyer's patches. Infect. Immun. 74:1516–1527. 10.1128/IAI.74.3.1516-1527.2006 - DOI - PMC - PubMed

Publication types

MeSH terms

Substances

LinkOut - more resources