

Poleward expansion of mangroves is a threshold response to decreased frequency of extreme cold events
- PMID: 24379379
- PMCID: PMC3896164
- DOI: 10.1073/pnas.1315800111
Poleward expansion of mangroves is a threshold response to decreased frequency of extreme cold events
Abstract
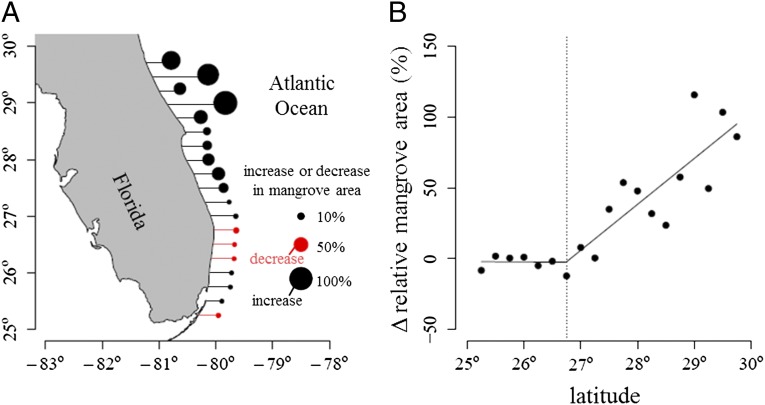
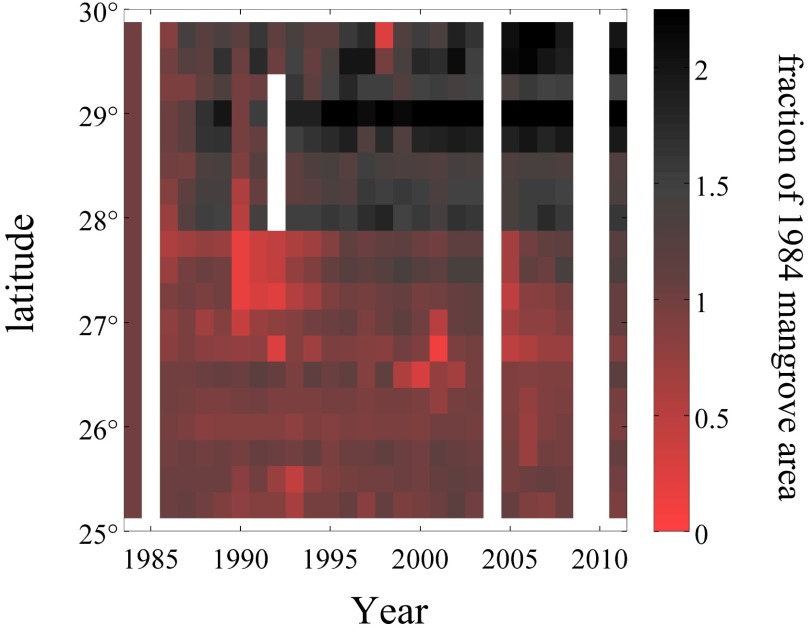
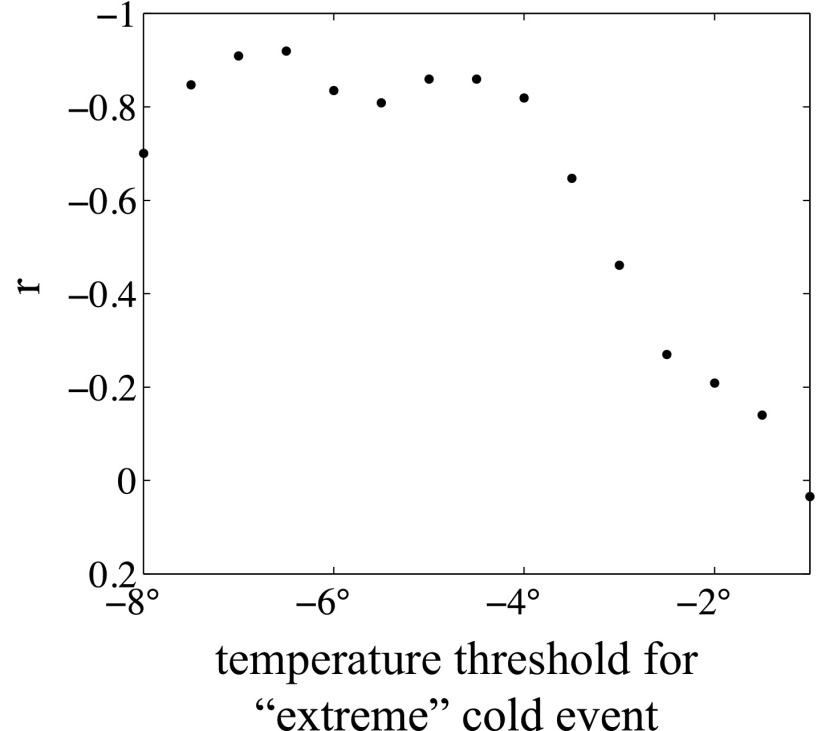
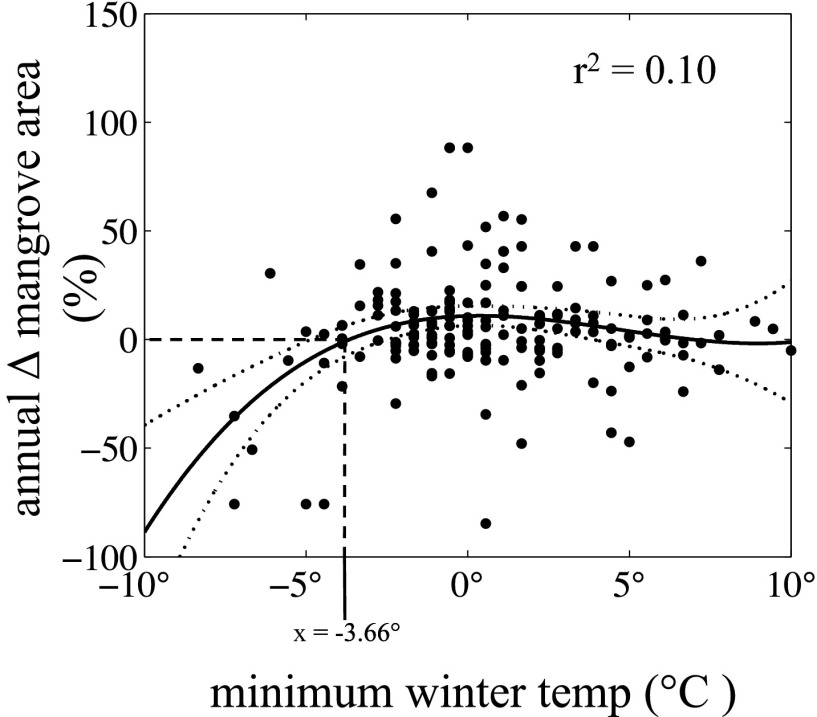
Regional warming associated with climate change is linked with altered range and abundance of species and ecosystems worldwide. However, the ecological impacts of changes in the frequency of extreme events have not been as well documented, especially for coastal and marine environments. We used 28 y of satellite imagery to demonstrate that the area of mangrove forests has doubled at the northern end of their historic range on the east coast of Florida. This expansion is associated with a reduction in the frequency of "extreme" cold events (days colder than -4 °C), but uncorrelated with changes in mean annual temperature, mean annual precipitation, and land use. Our analyses provide evidence for a threshold response, with declining frequency of severe cold winter events allowing for poleward expansion of mangroves. Future warming may result in increases in mangrove cover beyond current latitudinal limits of mangrove forests, thereby altering the structure and function of these important coastal ecosystems.
Keywords: Landsat; coastal wetlands; ecological threshold; frost tolerance.
Conflict of interest statement
The authors declare no conflict of interest.
Figures
Comment in
-
Mangrove reemergence in the northernmost range limit of eastern Florida.Proc Natl Acad Sci U S A. 2014 Apr 15;111(15):E1447-8. doi: 10.1073/pnas.1400687111. Epub 2014 Mar 14. Proc Natl Acad Sci U S A. 2014. PMID: 24632731 Free PMC article. No abstract available.
-
Reply to Giri and Long: Freeze-mediated expansion of mangroves does not depend on whether expansion is emergence or reemergence.Proc Natl Acad Sci U S A. 2014 Apr 15;111(15):E1449. doi: 10.1073/pnas.1401809111. Proc Natl Acad Sci U S A. 2014. PMID: 24851264 Free PMC article. No abstract available.
References
-
- Rosenzweig C, et al. Attributing physical and biological impacts to anthropogenic climate change. Nature. 2008;453(7193):353–357. - PubMed
-
- Chen IC, Hill JK, Ohlemüller R, Roy DB, Thomas CD. Rapid range shifts of species associated with high levels of climate warming. Science. 2011;333(6045):1024–1026. - PubMed
-
- Jentsch A, Kreyling J, Beierkuhnlein C. A new generation of climate-change experiments: Events, not trends. Front Ecol Environ. 2007;5(7):365–374.
-
- Wernberg T, et al. An extreme climatic event alters marine ecosystem structure in a global biodiversity hotspot. Nat Clim Change. 2012;3(1):78–82.
Publication types
MeSH terms
LinkOut - more resources
Full Text Sources
Other Literature Sources
Medical
