. 2014 Jan 14;111(2):664-9.
doi: 10.1073/pnas.1315735111. Epub 2013 Dec 30.

High-throughput platform for real-time monitoring of biological processes by multicolor single-molecule fluorescence

Affiliations

High-throughput platform for real-time monitoring of biological processes by multicolor single-molecule fluorescence

Jin Chen et al. Proc Natl Acad Sci U S A. .

Abstract

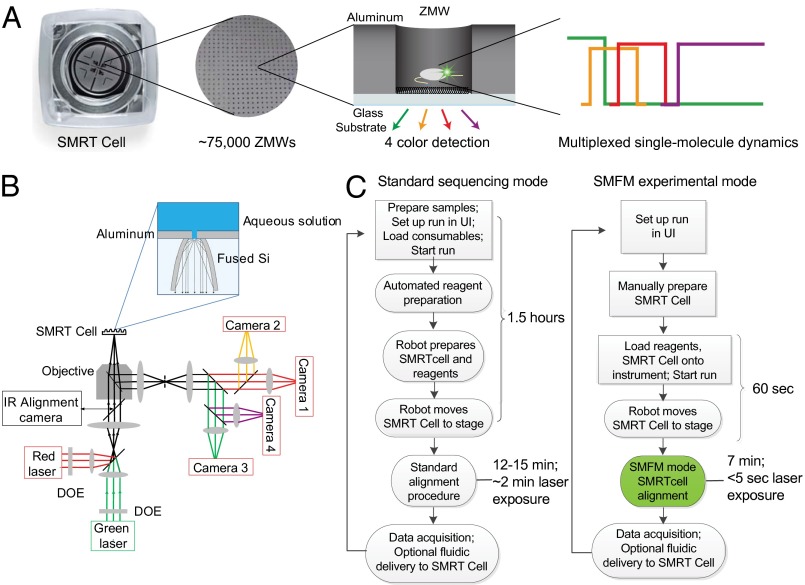
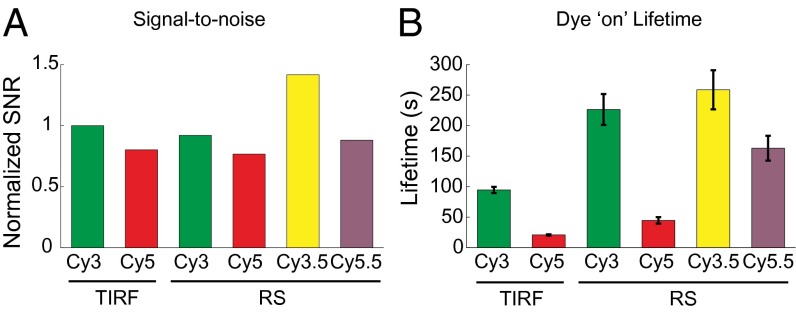
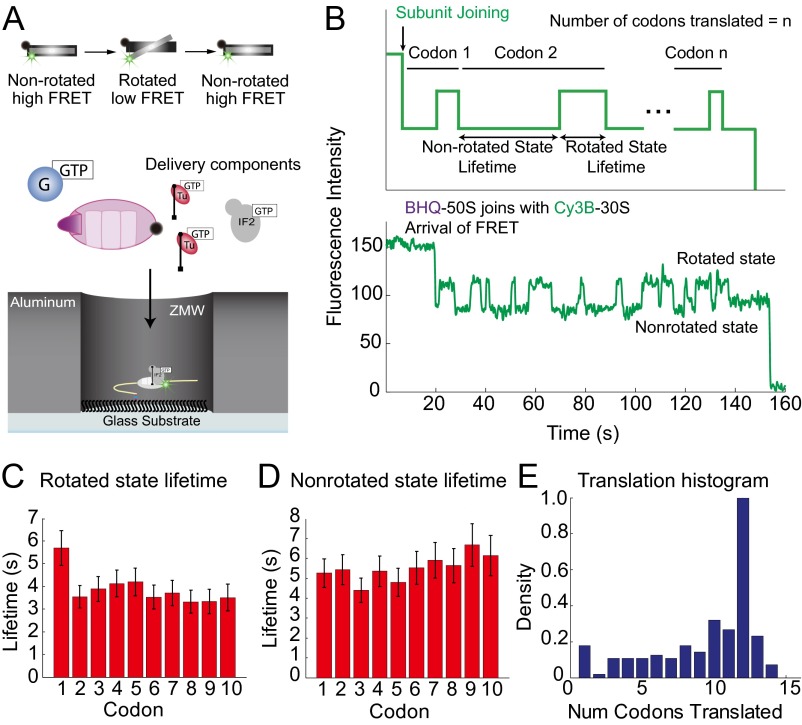
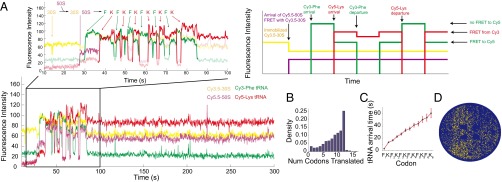
Zero-mode waveguides provide a powerful technology for studying single-molecule real-time dynamics of biological systems at physiological ligand concentrations. We customized a commercial zero-mode waveguide-based DNA sequencer for use as a versatile instrument for single-molecule fluorescence detection and showed that the system provides long fluorophore lifetimes with good signal to noise and low spectral cross-talk. We then used a ribosomal translation assay to show real-time fluidic delivery during data acquisition, showing it is possible to follow the conformation and composition of thousands of single biomolecules simultaneously through four spectral channels. This instrument allows high-throughput multiplexed dynamics of single-molecule biological processes over long timescales. The instrumentation presented here has broad applications to single-molecule studies of biological systems and is easily accessible to the biophysical community.


Conflict of interest statement

Conflict of interest statement: R.V.D., K.C., J. Cheng, M.E., P.-L.H., P.L., S.W.T., and D.R.H. are or were employees of Pacific Biosciences Inc., a company commercializing DNA sequencing technologies at the time that this work was completed.

Figures

Fig. 1.
Fig. 1.
Overview of the customized RS instrument. (A) An SMRT Cell consists of 150,000 ZMWs, of which ∼75,000 ZMWs can be simultaneously imaged, allowing multiplexed detection of thousands of single molecules in real time across four spectral channels. (B) Simplified optical schematic of the custom RS instrument: continuous excitation is provided by a 532-nm laser and a 642-nm laser, which are separated into ∼75,000 beamlets that illuminate the array of ZMWs on the SMRT Cell that sits on a six-axis stage during data acquisition. The emitted light from the SMRT Cell is collected through the same objective in epifluorescence mode; notch filters in the collection path block transmission of excitation wavelengths. Emitted light is collected on four high-speed complementary metal-oxide-semiconductor (CMOS) cameras. (C) Comparison of workflows for standard sequencing and SMFM experimental mode shows steps for users (square boxes) and instrument (ovals). Modifications made for the SMFM mode reduce time to stage, alignment time, and exposure of components to laser illumination to allow for flexible single-molecule studies with labile reagents. DOE, diffractive optical element.
Fig. 2.
Fig. 2.
Fluorophore characterizations on the custom RS. (A) Example traces of Cy3- (green), Cy3.5- (yellow), Cy5- (red), and Cy5.5-labeled (purple) biotinylated oligonucleotides immobilized on the bottom of the ZMWs under dual laser illumination (532 and 642 nm), showing the percentage of bleedthrough. (B) Normalized mean intensities of the four spectral channels for each colored dye. Spectral bleedthrough to the neighboring channel is ∼50%, whereas bleedthrough to the farther channels is negligible. The low bleedthrough allows efficient separation of the four spectral fluorophores. Numbers of molecules analyzed (from left to right) are n = 301, n = 265, n = 280, n = 200. Only a portion (∼5%, randomly picked) of the entire SMRT Cell was analyzed because of the large amount of data generated. Error bars are SEMs.
Fig. 3.
Fig. 3.
Comparison of fluorophore properties on the custom RS and TIRF. (A) The signal to noise on the home-built TIRF microscope and the custom RS (normalized to Cy3 on TIRF). SNRs on TIRF and RS are essentially equivalent under conditions in which experiments are normally conducted. (B) The continuous emission lifetimes of the dyes on TIRF and RS under constant laser illumination, showing a prolonged photostability of dyes on the custom RS, under conditions resulting in similar SNRs. These dye photostability lifetimes are measured under dual laser illumination. Error bars are SEMs.
Fig. 4.
Fig. 4.
Conformational dynamics by FRET on the custom RS. (A) Schematic of experiment showing immobilized Cy3B-labeled 30S preinitiation complex in the ZMW through a biotinylated mRNA and delivery of components. (B) Schematic of the expected signal sequence and example trace of ribosome conformational dynamics during elongation. (C) Rotated state (high intensity and low FRET) lifetimes for each codon, comparable with what we have reported previously (2, 24). Number of molecules analyzed was 254. Only a portion (∼40%) of the entire SMRT Cell was analyzed. (D) Nonrotated (low intensity and high FRET) lifetimes for each codon. All error bars are SEMs. (E) Histogram of ribosomes translating the particular number of codons. Most of the ribosomes translate 12 codons, which was expected from the sequence of the mRNA. The small numbers of additional events beyond the 12th codon shown in the histogram are likely caused by readthrough or statistical errors in the identification of transitions by our analytical method.
Fig. 5.
Fig. 5.
Compositional dynamics of fluorescent ligands on the custom RS. (A) Schematic of the expected signal sequence and example trace of ribosome compositional dynamics during late initiation showing that, although there is bleedthrough between Cy3 and Cy3.5 channels as well as Cy5 and Cy5.5 channels, the signal is sufficient to distinguish between the spectral channels. (B) Lifetimes for the Cy3-30S, Cy3.5-50S, and Cy5-Phe. Number of molecules analyzed was n = 307. Only a portion (∼5%) of the entire SMRT Cell was analyzed. (C) Arrival times for the Cy3.5-50S and Cy5-Phe tRNA. All error bars are SEMs. (D) Postsynchronization of the arrival of Cy5-Phe tRNA to the arrival of the Cy3.5-50S shown as a heatmap. The results were comparable to what was observed previously (25).
Fig. 6.
Fig. 6.
Multiplexed four-color dynamic experiment on the custom RS. (A) Sample trace and schematic showcasing the power of the custom RS to follow simultaneously the composition and conformation of four components. Cy3-tRNA Phe ternary complex, Cy5-tRNA Lys ternary complex, and Cy5.5-50S are delivered to immobilized Cy3.5-30S. Cy5.5-50S first joins with the Cy3.5-30S followed by alternating pulses of Cy3-tRNA Phe (F) and Cy5-tRNA Lys (K) as specified by the 6(FK) mRNA sequence. Despite overlapping bleedthrough signals, the signal is sufficient to distinguish between the spectral channels. (B) Histogram of ribosomes translating the particular number of codons. Most of the ribosomes translate 12 codons, which was expected from the sequence of the mRNA. (C) tRNA arrival times for 12 codons. All error bars are SEMs. Number of molecules analyzed was n = 3,354. (D) A chip view visualizing molecules (yellow spots) exhibiting all four fluorescent colors, with multiple red and green pulses within a given ZMW hole on the chip.

References

    1. Moran-Mirabal JM, Craighead HG. Zero-mode waveguides: Sub-wavelength nanostructures for single molecule studies at high concentrations. Methods. 2008;46(1):11–17. - PubMed
    1. Chen J, Tsai A, Petrov A, Puglisi JD. Nonfluorescent quenchers to correlate single-molecule conformational and compositional dynamics. J Am Chem Soc. 2012;134(13):5734–5737. - PMC - PubMed
    1. Lee J, et al. Single-molecule four-color FRET. Angew Chem Int Ed Engl. 2010;49(51):9922–9925. - PMC - PubMed
    1. Hohng S, Joo C, Ha T. Single-molecule three-color FRET. Biophys J. 2004;87(2):1328–1337. - PMC - PubMed
    1. Lee S, Lee J, Hohng S. Single-molecule three-color FRET with both negligible spectral overlap and long observation time. PLoS One. 2010;5(8):e12270. - PMC - PubMed

Publication types

MeSH terms