

A positive cooperativity binding model between Ly49 natural killer cell receptors and the viral immunoevasin m157: kinetic and thermodynamic studies
- PMID: 24379405
- PMCID: PMC3931067
- DOI: 10.1074/jbc.M113.532929
A positive cooperativity binding model between Ly49 natural killer cell receptors and the viral immunoevasin m157: kinetic and thermodynamic studies
Erratum in
-
A positive cooperativity binding model between Ly49 natural killer cell receptors and the viral immunoevasin m157. KINETIC AND THERMODYNAMIC STUDIES.J Biol Chem. 2015 Aug 14;290(33):20098-9. doi: 10.1074/jbc.A113.532929. J Biol Chem. 2015. PMID: 26276853 Free PMC article. No abstract available.
Abstract
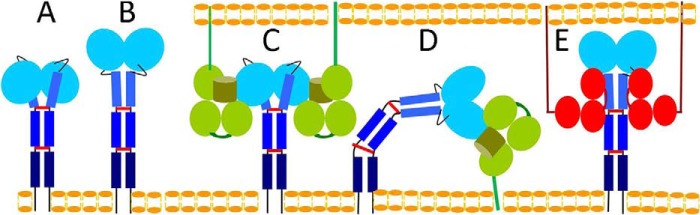
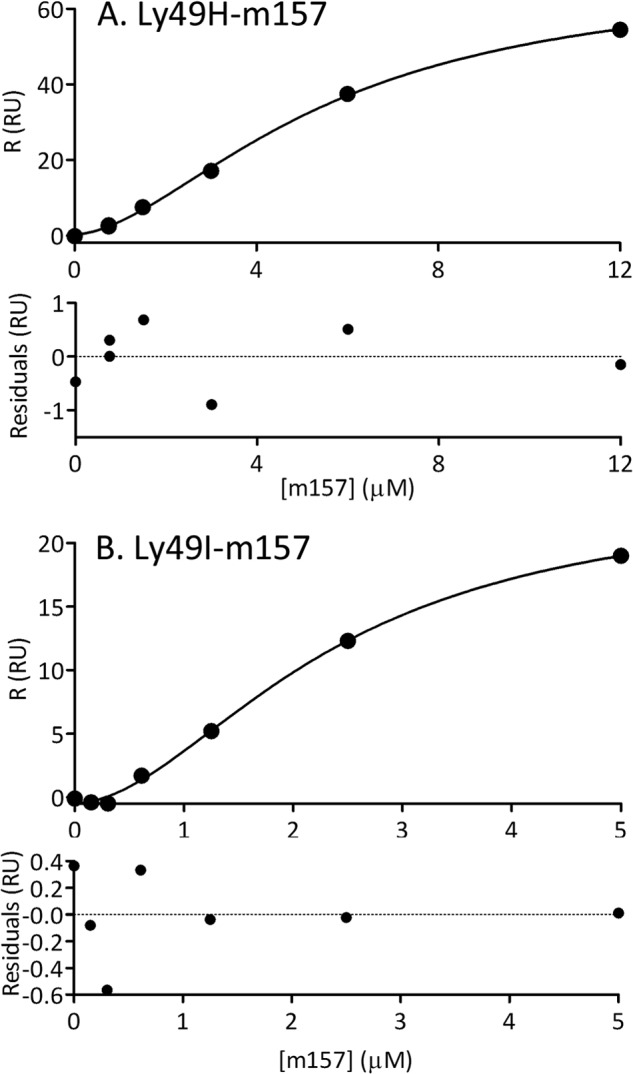
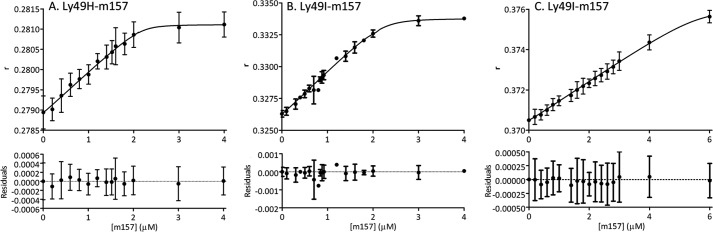
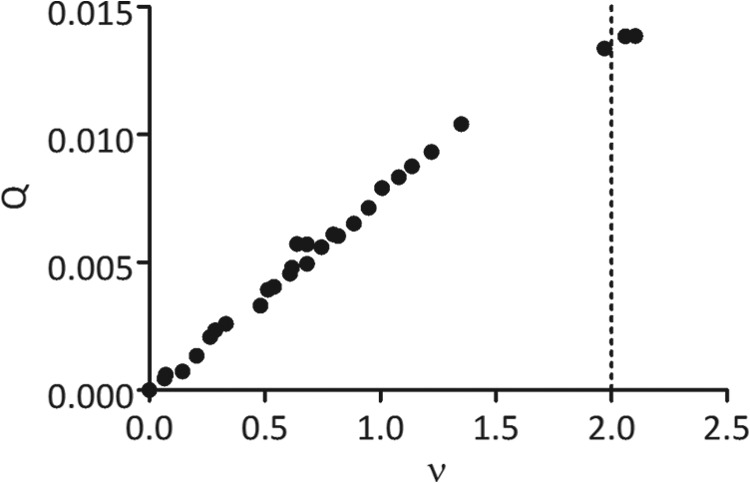
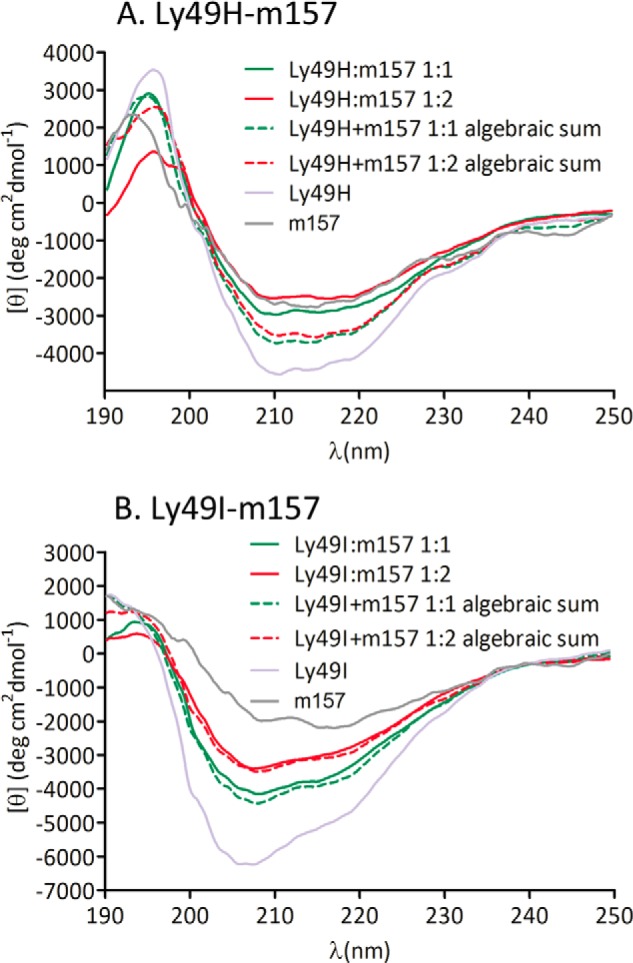
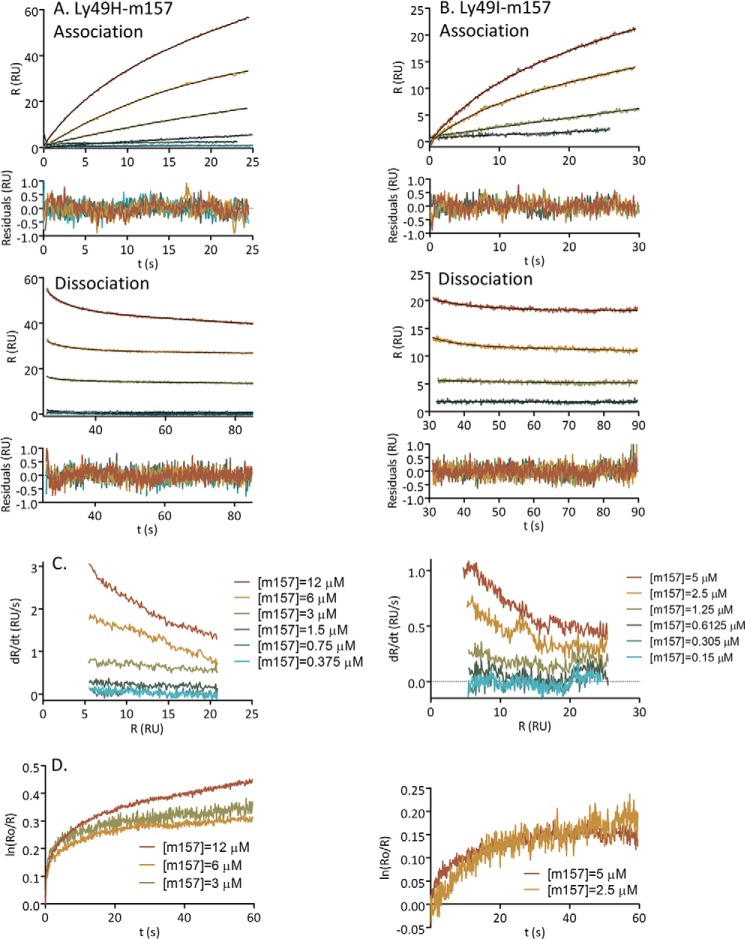
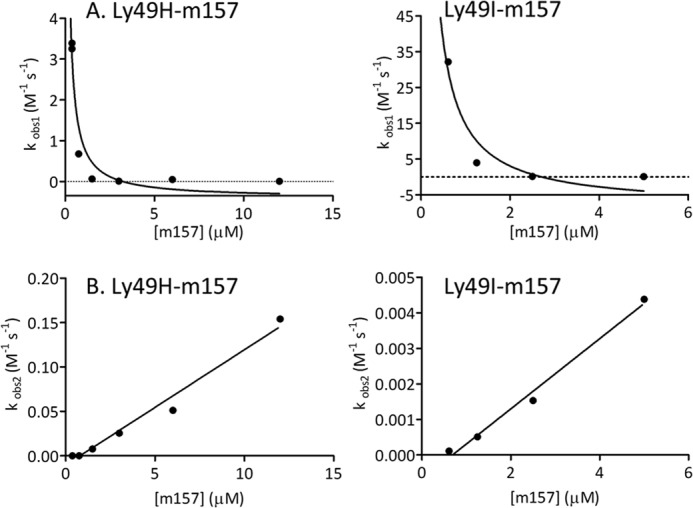
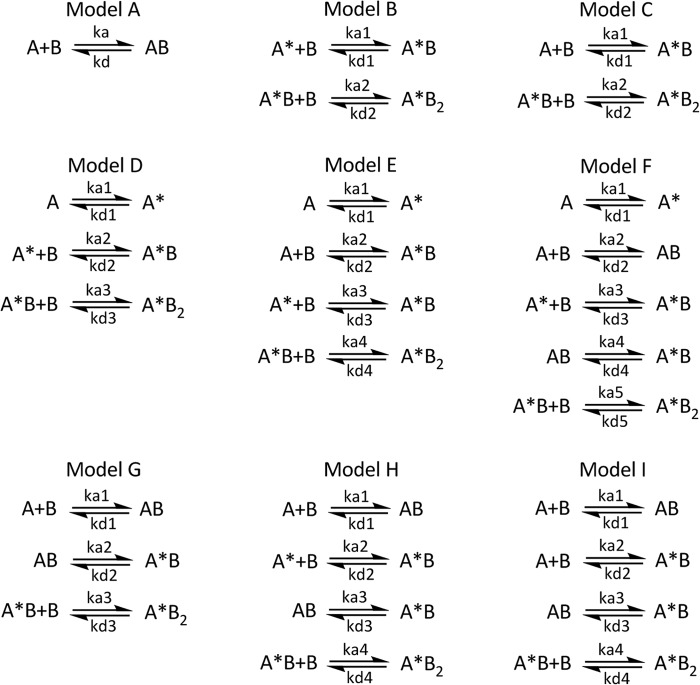
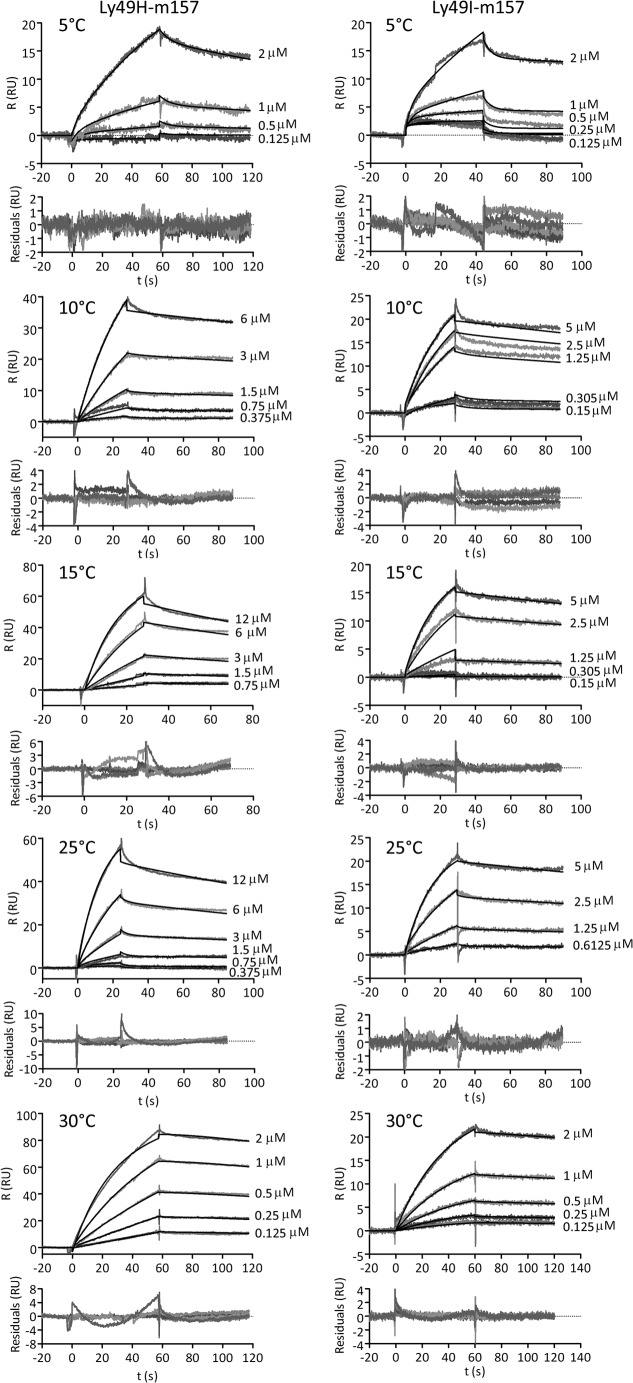
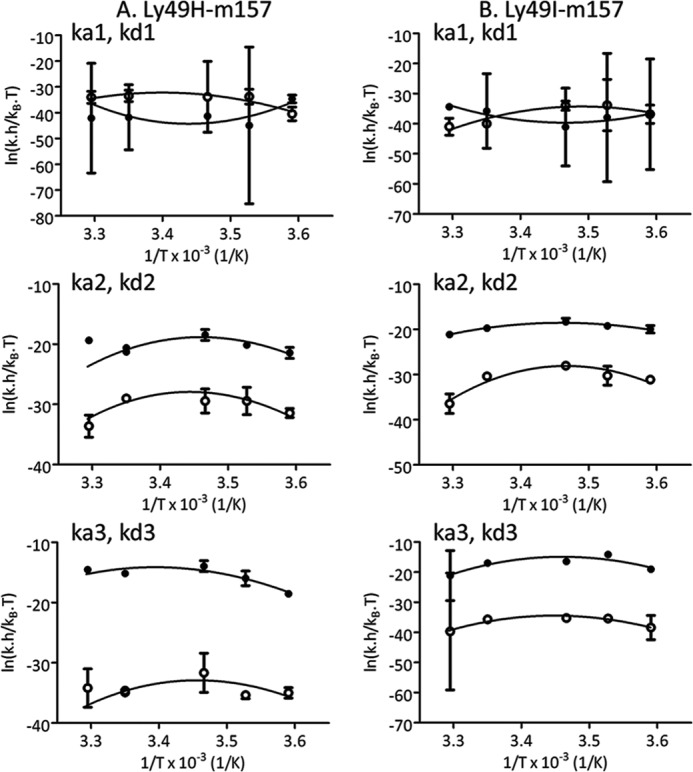
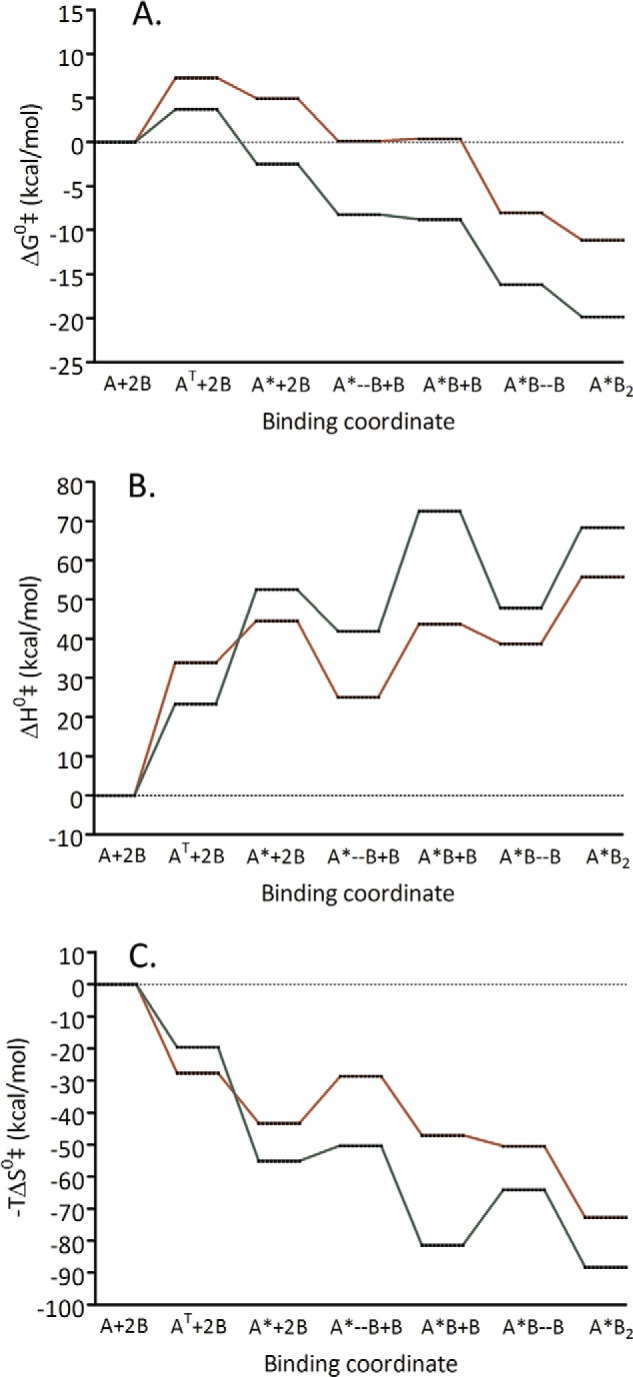
Natural killer (NK) cells discriminate between healthy and virally infected or transformed cells using diverse surface receptors that are both activating and inhibitory. Among them, the homodimeric Ly49 NK receptors, which can adopt two distinct conformations (backfolded and extended), are of particular importance for detecting cells infected with mouse cytomegalovirus (CMV) via recognition of the viral immunoevasin m157. The interaction of m157 with activating (Ly49H) and inhibitory (Ly49I) receptors governs the spread of mouse CMV. We carried out kinetic and thermodynamic experiments to elucidate the Ly49/m157 binding mechanism. Combining surface plasmon resonance, fluorescence anisotropy, and circular dichroism (CD), we determined that the best model to describe both the Ly49H/m157 and Ly49I/m157 interactions is a conformational selection mechanism where only the extended conformation of Ly49 (Ly49*) is able to bind the first m157 ligand followed by binding of the Ly49*/m157 complex to the second m157. The interaction is characterized by strong positive cooperativity such that the second m157 binds the Ly49 homodimer with a 1000-fold higher sequential constant than the first m157 (∼10(8) versus ∼10(5) M(-1)). Using far-UV CD, we obtained evidence for a conformational change in Ly49 upon binding m157 that could explain the positive cooperativity. The rate-limiting step of the overall mechanism is a conformational transition in Ly49 from its backfolded to extended form. The global thermodynamic parameters from the initial state (backfolded Ly49 and m157) to the final state (Ly49*/(m157)2) are characterized by an unfavorable enthalpy that is compensated by a favorable entropy, making the interaction spontaneous.
Keywords: Fluorescence Anisotropy; Innate Immunity; Ly49; Murine Cytomegalovirus; Natural Killer (NK) Cell; Surface Plasmon Resonance (SPR); Thermodynamics; Viral Immunology; m157.
Figures
Similar articles
-
Kinetic and thermodynamic studies of the interaction between activating and inhibitory Ly49 natural killer receptors and MHC class I molecules.Biochem J. 2017 Jan 1;474(1):179-194. doi: 10.1042/BCJ20160876. Epub 2016 Nov 9. Biochem J. 2017. PMID: 27831490
-
Critical residues at the Ly49 natural killer receptor's homodimer interface determine functional recognition of m157, a mouse cytomegalovirus MHC class I-like protein.J Immunol. 2007 Jan 1;178(1):369-77. doi: 10.4049/jimmunol.178.1.369. J Immunol. 2007. PMID: 17182575
-
Structural elucidation of the m157 mouse cytomegalovirus ligand for Ly49 natural killer cell receptors.Proc Natl Acad Sci U S A. 2007 Jun 12;104(24):10128-33. doi: 10.1073/pnas.0703735104. Epub 2007 May 30. Proc Natl Acad Sci U S A. 2007. PMID: 17537914 Free PMC article.
-
The Ly49 natural killer cell receptors: a versatile tool for viral self-discrimination.Immunol Cell Biol. 2014 Mar;92(3):214-20. doi: 10.1038/icb.2013.100. Epub 2014 Jan 14. Immunol Cell Biol. 2014. PMID: 24418814 Review.
-
Structural and functional aspects of the Ly49 natural killer cell receptors.Immunol Cell Biol. 2005 Feb;83(1):1-8. doi: 10.1111/j.1440-1711.2004.01301.x. Immunol Cell Biol. 2005. PMID: 15661035 Review.
Cited by
-
MCMV avoidance of recognition and control by NK cells.Semin Immunopathol. 2014 Nov;36(6):641-50. doi: 10.1007/s00281-014-0441-9. Epub 2014 Aug 21. Semin Immunopathol. 2014. PMID: 25141793 Review.
-
Peptidoglycan recognition protein-peptidoglycan complexes increase monocyte/macrophage activation and enhance the inflammatory response.Immunology. 2015 Jul;145(3):429-42. doi: 10.1111/imm.12460. Epub 2015 Apr 16. Immunology. 2015. PMID: 25752767 Free PMC article.
-
The structure of the cytomegalovirus-encoded m04 glycoprotein, a prototypical member of the m02 family of immunoevasins.J Biol Chem. 2014 Aug 22;289(34):23753-63. doi: 10.1074/jbc.M114.584128. Epub 2014 Jun 30. J Biol Chem. 2014. PMID: 24982419 Free PMC article.
-
Structural basis for recognition of cellular and viral ligands by NK cell receptors.Front Immunol. 2014 Mar 26;5:123. doi: 10.3389/fimmu.2014.00123. eCollection 2014. Front Immunol. 2014. PMID: 24723923 Free PMC article. Review.
References
-
- McQueen K. L., Parham P. (2002) Variable receptors controlling activation and inhibition of NK cells. Curr. Opin. Immunol. 14, 615–621 - PubMed
-
- Yokoyama W. M., Plougastel B. F. (2003) Immune functions encoded by the natural killer gene complex. Nat. Rev. Immunol. 3, 304–316 - PubMed
-
- Lanier L. L. (2005) NK cell recognition. Annu. Rev. Immunol. 23, 225–274 - PubMed
-
- Arase H., Mocarski E. S., Campbell A. E., Hill A. B., Lanier L. L. (2002) Direct recognition of cytomegalovirus by activating and inhibitory NK cell receptors. Science 296, 1323–1326 - PubMed
Publication types
MeSH terms
Substances
Grants and funding
LinkOut - more resources
Full Text Sources
Other Literature Sources
