

Control of Foxo1 gene expression by co-activator P300
- PMID: 24379407
- PMCID: PMC3924295
- DOI: 10.1074/jbc.M113.540500
Control of Foxo1 gene expression by co-activator P300
Abstract
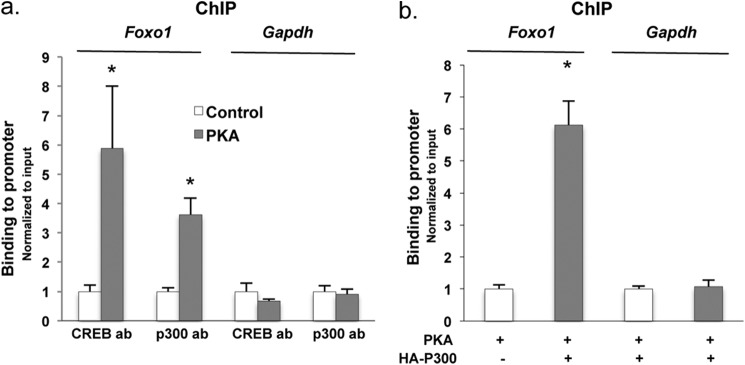
FOXO1 is an important downstream mediator of the insulin signaling pathway. In the fed state, elevated insulin phosphorylates FOXO1 via AKT, leading to its nuclear exclusion and degradation. A reduction in nuclear FOXO1 levels then leads to suppression of hepatic glucose production. However, the mechanism leading to expression of Foxo1 gene in the fasted state is less clear. We found that Foxo1 mRNA and FOXO1 protein levels of Foxo1 were increased significantly in the liver of mice after 16 h of fasting. Furthermore, dibutyrl cAMP stimulated the expression of Foxo1 at both mRNA and protein level in hepatocytes. Because cAMP-PKA regulates hepatic glucose production through cAMP-response element-binding protein co-activators, we depleted these co-activators using adenoviral shRNAs. Interestingly, only depletion of co-activator P300 resulted in the decrease of Foxo1 mRNA and FOXO1 protein levels. In addition, inhibition of histone acetyltransferase activity of P300 significantly decreased hepatic Foxo1 mRNA and FOXO1 protein levels in fasted mice, as well as fasting blood glucose levels. By characterization of Foxo1 gene promoter, P300 regulates the Foxo1 gene expression through the binding to tandem cAMP-response element sites in the proximal promoter region of Foxo1 gene.
Keywords: CREB; Foxo; Gluconeogenesis; Histone Acetylase; P300.
Figures


Similar articles
-
A fasting inducible switch modulates gluconeogenesis via activator/coactivator exchange.Nature. 2008 Nov 13;456(7219):269-73. doi: 10.1038/nature07349. Epub 2008 Oct 5. Nature. 2008. PMID: 18849969 Free PMC article.
-
Insulin regulates liver metabolism in vivo in the absence of hepatic Akt and Foxo1.Nat Med. 2012 Feb 19;18(3):388-95. doi: 10.1038/nm.2686. Nat Med. 2012. PMID: 22344295 Free PMC article.
-
TCF7L2 modulates glucose homeostasis by regulating CREB- and FoxO1-dependent transcriptional pathway in the liver.PLoS Genet. 2012 Sep;8(9):e1002986. doi: 10.1371/journal.pgen.1002986. Epub 2012 Sep 27. PLoS Genet. 2012. PMID: 23028378 Free PMC article.
-
CREB and FoxO1: two transcription factors for the regulation of hepatic gluconeogenesis.BMB Rep. 2013 Dec;46(12):567-74. doi: 10.5483/bmbrep.2013.46.12.248. BMB Rep. 2013. PMID: 24238363 Free PMC article. Review.
-
The transcription factors CREBH, PPARa, and FOXO1 as critical hepatic mediators of diet-induced metabolic dysregulation.J Nutr Biochem. 2021 Sep;95:108633. doi: 10.1016/j.jnutbio.2021.108633. Epub 2021 Mar 28. J Nutr Biochem. 2021. PMID: 33789150 Free PMC article. Review.
Cited by
-
Haploinsufficiency of the Insulin Receptor in the Presence of a Splice-Site Mutation in Ppp2r2a Results in a Novel Digenic Mouse Model of Type 2 Diabetes.Diabetes. 2016 May;65(5):1434-46. doi: 10.2337/db15-1276. Epub 2016 Feb 11. Diabetes. 2016. PMID: 26868295 Free PMC article.
-
Flavin containing monooxygenase 3 exerts broad effects on glucose and lipid metabolism and atherosclerosis.J Lipid Res. 2015 Jan;56(1):22-37. doi: 10.1194/jlr.M051680. Epub 2014 Nov 6. J Lipid Res. 2015. PMID: 25378658 Free PMC article.
-
Bile acid metabolism and signaling in health and disease: molecular mechanisms and therapeutic targets.Signal Transduct Target Ther. 2024 Apr 26;9(1):97. doi: 10.1038/s41392-024-01811-6. Signal Transduct Target Ther. 2024. PMID: 38664391 Free PMC article. Review.
-
p300 Regulates Liver Functions by Controlling p53 and C/EBP Family Proteins through Multiple Signaling Pathways.Mol Cell Biol. 2015 Sep 1;35(17):3005-16. doi: 10.1128/MCB.00421-15. Epub 2015 Jun 22. Mol Cell Biol. 2015. PMID: 26100016 Free PMC article.
-
USP7 attenuates hepatic gluconeogenesis through modulation of FoxO1 gene promoter occupancy.Mol Endocrinol. 2014 Jun;28(6):912-24. doi: 10.1210/me.2013-1420. Epub 2014 Apr 2. Mol Endocrinol. 2014. PMID: 24694308 Free PMC article.
References
-
- Vannucci R. C., Vannucci S. J. (2001) Hypoglycemic brain injury. Semin. Neonatol. 6, 147–155 - PubMed
-
- Desouza C., Salazar H., Cheong B., Murgo J., Fonseca V. (2003) Association of hypoglycemia and cardiac ischemia: a study based on continuous monitoring. Diabetes Care 26, 1485–1489 - PubMed
-
- Einarsdóttir A. B., Stefánsson E. (2009) Prevention of diabetic retinopathy. Lancet 373, 1316–1318 - PubMed
-
- Bellentani S., Marino M. (2009) Epidemiology and natural history of nonalcoholic fatty liver disease (NAFLD). Ann. Hepatol. 8, S4–S8 - PubMed
-
- Krebs E. G. (1989) Role of the cyclic AMP-dependent protein kinase in signal transduction. JAMA 262, 1815–1818 - PubMed
Publication types
MeSH terms
Substances
Grants and funding
LinkOut - more resources
Full Text Sources
Other Literature Sources
Molecular Biology Databases
Research Materials
Miscellaneous
