. 2014 Mar;34(6):955-64.
doi: 10.1128/MCB.00842-13. Epub 2013 Dec 30.

Cross talk between CD3 and CD28 is spatially modulated by protein lateral mobility

Affiliations

Cross talk between CD3 and CD28 is spatially modulated by protein lateral mobility

Keenan T Bashour et al. Mol Cell Biol. 2014 Mar.

Abstract

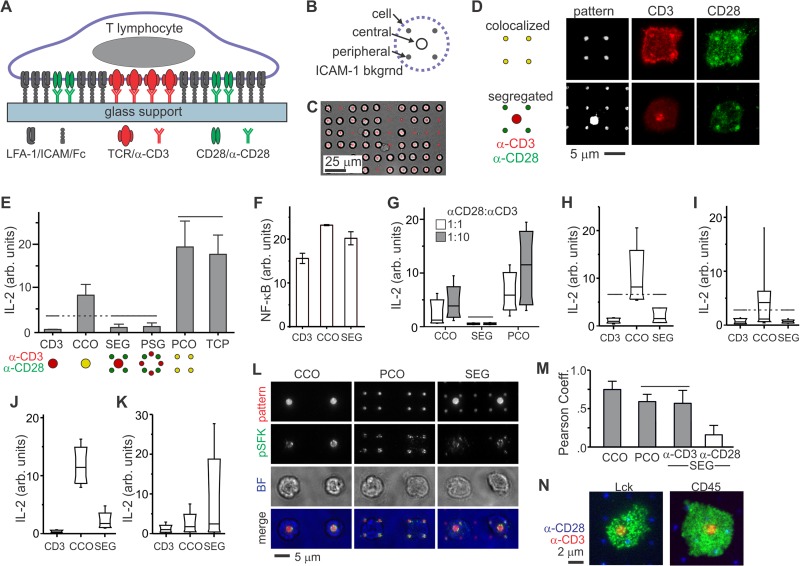
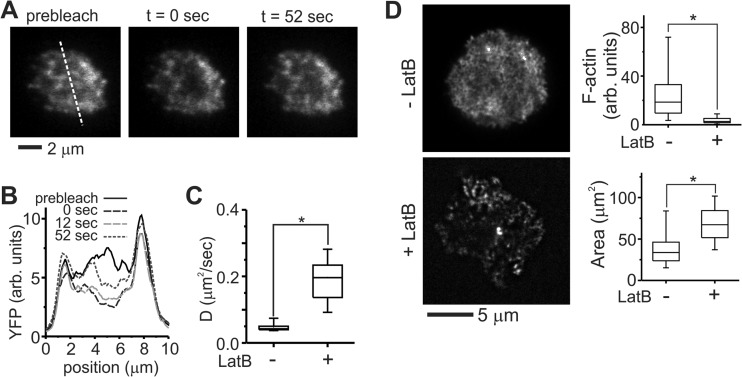
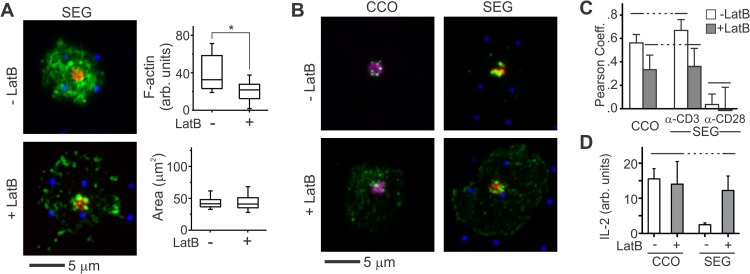
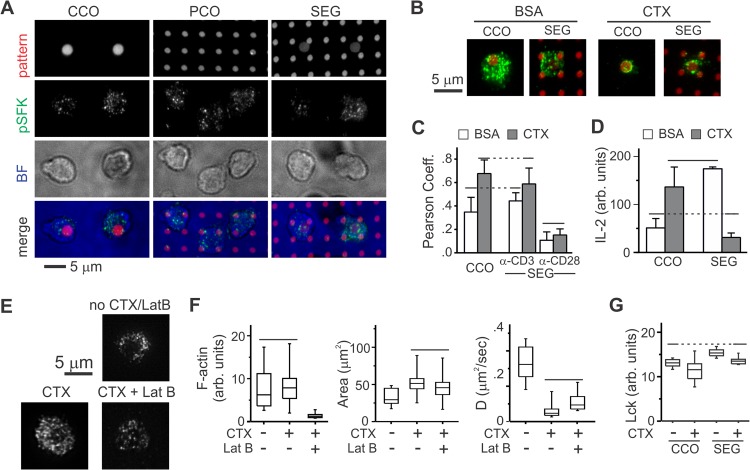
Functional convergence of CD28 costimulation and TCR signaling is critical to T-cell activation and adaptive immunity. These receptors form complex microscale patterns within the immune synapse, although the impact of this spatial organization on cell signaling remains unclear. We investigate this cross talk using micropatterned surfaces that present ligands to these membrane proteins in order to control the organization of signaling molecules within the cell-substrate interface. While primary human CD4(+) T cells were activated by features containing ligands to both CD3 and CD28, this functional convergence was curtailed on surfaces in which engagement of these two systems was separated by micrometer-scale distances. Moreover, phosphorylated Lck was concentrated to regions of CD3 engagement and exhibited a low diffusion rate, suggesting that costimulation is controlled by a balance between the transport of active Lck to CD28 and its deactivation. In support of this model, disruption of the actin cytoskeleton increased Lck mobility and allowed functional T-cell costimulation by spatially separated CD3 and CD28. In primary mouse CD4(+) T cells, a complementary system, reducing the membrane mobility increased the sensitivity to CD3-CD28 separation. These results demonstrate a subcellular reaction-diffusion system that allows cells to sense the microscale organization of the extracellular environment.


Figures

FIG 1
FIG 1
Primary human CD4+ T cells from peripheral blood sense the microscale separation of CD3 and CD28 signaling. (A) Micropatterned surfaces provide control over the molecular organization of an artificial synapse. (B) Layout of an individual costimulation site. (C) Long-range arraying of primary human T cells on micropatterned surface, 30 min after initiation of cell-surface contact. (D) Local, microscale control over the layout of TCR (CD3) and CD28 within artificial immune synapses by patterning of anti-CD3 (OKT3) and anti-CD28 (9.3). These cells were fixed and stained 30 min after initiation of cell-surface contact. (E) IL-2 secretion was curtailed by separation of CD3 and CD28 engagement by micrometer-scale distances. TCP = antibody coated tissue culture plastic. The data are means ± the SD from >2,000 cells per surface (n = 5 independent experiments) and were compared by using ANOVA/Tukey methods; overbars group conditions that are not statistically different (α = 0.05). (F) Translocation of NF-κB in response to surface patterning. The data represent mean ± the SD. from three independent experiments, representing 17 to 25 cells per sample. Each condition was statistically different from all others (ANOVA/Tukey multiple comparison, α = 0.05). (G) Changing the relative concentrations of OKT3 and 9.3 in the micropatterning process did not alter the sensitivity of human CD4+ T cells to segregated costimulation. The standard ratio of OKT3 to 9.3 is 1:3. The data are box plots from a representative experiment, representing more than 2,000 cells per surface, and compared using ANOVA/Tukey methods (α = 0.05). (H and I) Replacing OKT3 with HIT3a (H) or 9.3 with CD28.6 (I) did not change the sensitivity of cells to segregated patterns. The data are box plots from representative experiments (n > 2,000 cells for each condition) and were analyzed using Kruskal-Wallis/Tukey methods (α = 0.05). (J and K) Comparison of IL-2 secretion by CD4+ T cells from human umbilical cord blood (J) and mouse peripheral blood (K). The data represent >2,000 cells for each condition from a representative experiment. Within each experiment, each condition was statistically different from all others, as analyzed using Kruskal-Wallis/Tukey methods (α = 0.05). (L) Activated Lck in primary human CD4+ T cells is tightly associated with features of anti-CD3. Cells were stained 15 min after initiation of cell-substrate contact. Pattern, anti-CD3 and anti-CD28; pSFK, anti-pY394; BF, bright field. (M) Quantitative comparison of pLck correlation with anti-CD3 and anti-CD28. The data represent means ± the SD for 10 to 15 cells on each pattern. The data were analyzed by ANOVA/Tukey methods (α = 0.05). (N) Total Lck and CD45 were uniformly distributed across the cell-surface interface. These representative cells were fixed 15 min after substrate contact.
FIG 2
FIG 2
The IS cytoskeletal network hinders mobility of membrane proteins. (A) The long-range diffusion coefficient of Lck was estimated by FRAP. This series of images illustrates the distribution of Lck-YFP before, immediately after, and 52 s after photobleaching. (B) Line profiles of Lck-YFP taken across the dotted line indicated in panel A, illustrating recovery of Lck-YFP. (C) Comparison of long-range Lck-YFP mobility in human CD4+ T cells with or without wash-in of 1 μM LatB. The data are box plots from a representative experiment, 7 to 15 cells per condition, and were compared using Kruskal-Wallis methods (*, P < 0.005). (D) LatB treatment disrupted a dense F-actin network at the cell-substrate interface. Cells were fixed 30 min after seeding. Each image was individually adjusted for brightness and contrast to allow visualization of F-actin structures and are thus not comparable on a quantitative basis. F-actin staining is compared quantitatively in the top graph, whereas the lower one compares cell spreading in response to LatB wash-in. The data for both graphs are box plots from a representative experiment, >17 cells per condition. The data were compared using Kruskal-Wallis methods (*, P < 0.005).
FIG 3
FIG 3
Increased mobility of membrane proteins allows primary human T cells to respond to segregated patterns. (A) LatB wash-in disrupts the IS cytoskeleton and decreases localization of pSFK to OKT3-containing features on micropatterned surfaces. These images illustrate primary human T cells 30 min after seeding on a SEG patterned surface and show anti-CD3 (red), anti-CD28 (blue), and F-actin (green). The graphs quantitatively compare per-area actin intensity and cell spreading. The data are from a representative experiment (n > 20 cells per surface). The data were compared using Kruskal-Wallis methods (*, P < 0.005). (B) LatB wash-in also changed the distribution of pSFK (green) within these cells. These images illustrate cells 30 min after seeding on CCO and SEG patterns. Areas of anti-CD3 and anti-CD28 are shown in red and blue, respectively, while colocalized patterns appear in purple. (C) Wash-in of LatB changes pLck correlation with anti-CD3 and anti-CD28. The data represent means ± the SD for 10 to 15 cells on each pattern. The data were analyzed using ANOVA/Tukey methods (α = 0.05). (D) IL-2 secretion on segregated but not colocalized patterns is enhanced by application of LatB. The data are means ± the SD from three experiments and were analyzed using ANOVA/Tukey methods (α = 0.05).
FIG 4
FIG 4
The response of primary mouse cells to micropatterned costimulation is consistent with a diffusion-based model. (A) Staining for pSFK in primary mouse cells is spread across the cell-substrate interface. Cells were fixed 15 min after contact with the substrate. Pattern, anti-CD3 and anti-CD28; pSFK, anti-pY394; BF, bright field. (B) Inclusion of CTX on the substrate surface increases localization of pSFK to anti-CD3 features. In these images, anti-CD3 and anti-CD28 in the CCO and SEG patterns are shown in red, whereas pSFK is in green. (C) Quantitative comparison of the effect of CTX on localization of pSFK. The data are means ± the SD from 10 to 15 cells per condition and were compared by ANOVA/Tukey methods (α = 0.05). (D) Comparison of IL-2 secretion as a function of pattern and CTX. The data are means ± the SD across three experiments, which were analyzed using ANOVA/Tukey methods (α = 0.05). (E) Actin structure as a function of surface-immobilized CTX and LatB wash-in. These images were individually adjusted for brightness and contrast to allow visualization of F-actin structures. (F) Quantitative comparison of F-actin staining intensity, cell spreading, and Lck-YFP diffusion coefficient as a function of CTX and LatB. In each representative experiment, data are from 8 to 16 cells per surface and were compared using Kruskal-Wallis/Tukey methods (α = 0.05). (G) Comparison of average Lck signal in the cell-substrate interface as a function of pattern and CTX inclusion. The data for this representative experiment are from 12 to 49 cells per condition and were compared using ANOVA/Tukey methods (α = 0 0.05).

References

    1. Dustin ML, Olszowy MW, Holdorf AD, Li J, Bromley S, Desai N, Widder P, Rosenberger F, van der Merwe PA, Allen PM, Shaw AS. 1998. A novel adaptor protein orchestrates receptor patterning and cytoskeletal polarity in T-cell contacts. Cell 94:667–677. 10.1016/S0092-8674(00)81608-6 - DOI - PubMed
    1. Grakoui A, Bromley SK, Sumen C, Davis MM, Shaw AS, Allen PM, Dustin ML. 1999. The immunological synapse: a molecular machine controlling T cell activation. Science 285:221–227. 10.1126/science.285.5425.221 - DOI - PubMed
    1. Monks CR, Freiberg BA, Kupfer H, Sciaky N, Kupfer A. 1998. Three-dimensional segregation of supramolecular activation clusters in T cells. Nature 395:82–86. 10.1038/25764 - DOI - PubMed
    1. Brossard C, Feuillet V, Schmitt A, Randriamampita C, Romao M, Raposo G, Trautmann A. 2005. Multifocal structure of the T cell-dendritic cell synapse. Eur. J. Immunol. 35:1741–1753. 10.1002/eji.200425857 - DOI - PubMed
    1. Purtic B, Pitcher LA, van Oers NSC, Wulfing C. 2005. T cell receptor (TCR) clustering in the immunological synapse integrates TCR and costimulatory signaling in selected T cells. Proc. Natl. Acad. Sci. U. S. A. 102:2904–2909. 10.1073/pnas.0406867102 - DOI - PMC - PubMed

Publication types