. 2013 May 16:4:127-39.
doi: 10.2147/OAJSM.S39843. eCollection 2013.

A simulation of cross-country skiing on varying terrain by using a mathematical power balance model

Affiliations

A simulation of cross-country skiing on varying terrain by using a mathematical power balance model

John F Moxnes et al. Open Access J Sports Med. .

Abstract

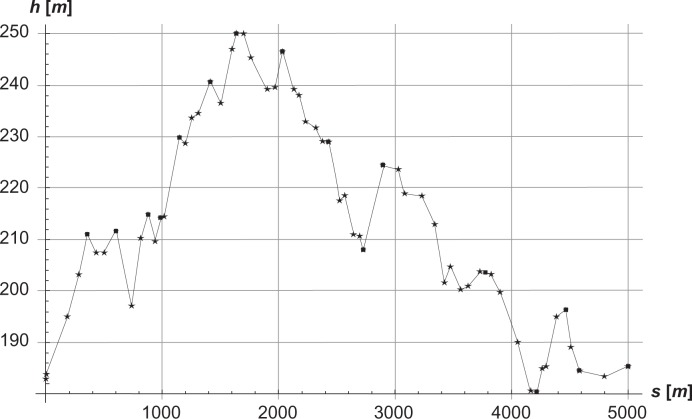
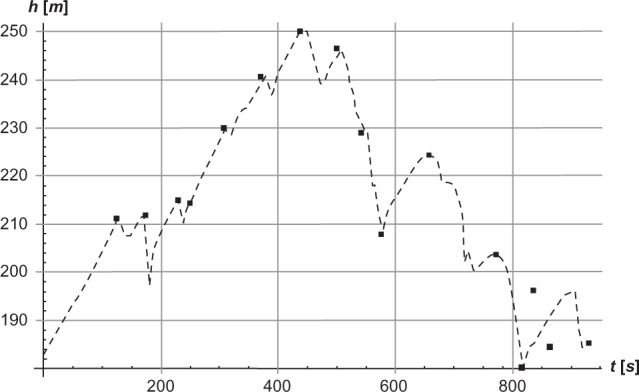
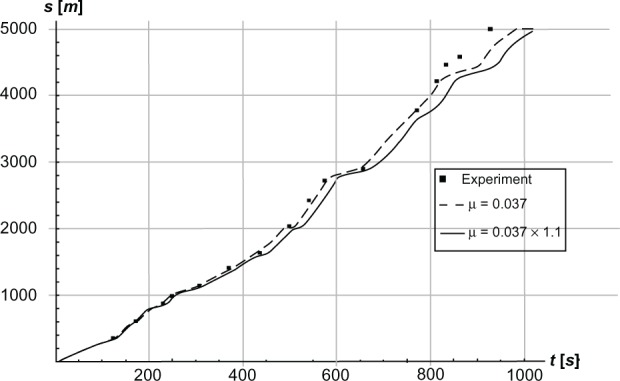
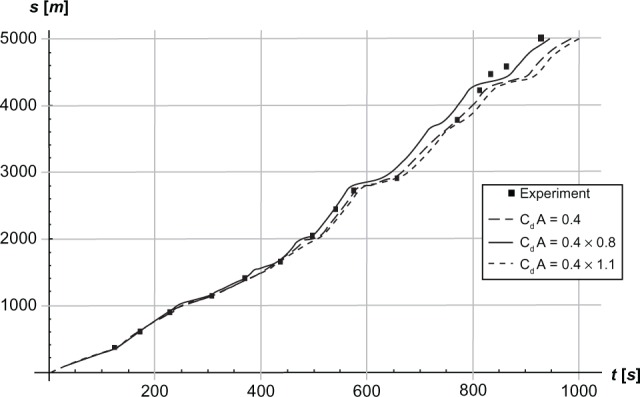
The current study simulated cross-country skiing on varying terrain by using a power balance model. By applying the hypothetical inductive deductive method, we compared the simulated position along the track with actual skiing on snow, and calculated the theoretical effect of friction and air drag on skiing performance. As input values in the model, air drag and friction were estimated from the literature, whereas the model included relationships between heart rate, metabolic rate, and work rate based on the treadmill roller-ski testing of an elite cross-country skier. We verified this procedure by testing four models of metabolic rate against experimental data on the treadmill. The experimental data corresponded well with the simulations, with the best fit when work rate was increased on uphill and decreased on downhill terrain. The simulations predicted that skiing time increases by 3%-4% when either friction or air drag increases by 10%. In conclusion, the power balance model was found to be a useful tool for predicting how various factors influence racing performance in cross-country skiing.

Keywords: air drag; friction coefficient; metabolic rate; power balance; skiing; work rate.


Figures

Figure 1
Figure 1
Metabolic rate Q (P, α) as a function of work rate P for angles of inclinations of α = 0.02 radians (upper line), 0.05 radians, 0.08 radians, and 0.12 radians (lower line) while treadmill roller-skiing using the skating technique. Notes: The curve fittings are based on linear interpolation through the experimental points. Metabolic rate of zero work rate Q0 = 332 J/s. Maximal metabolic rate QAmax = 1887 Joules per second (J/s) (represented by a straight upper line). ★: Experimental values for α = 0.02 radians. ■: Experimental values for α = 0.05 radians. ☆: Experimental values for α= 0.08 radians. ▲: Experimental values for α = 0.12 radians.
Figure 2
Figure 2
The λ(α) function in Equation 14 where λ(α) is a convexly decreasing function of the angle of inclination α.
Figure 3
Figure 3
Speed v and angle of inclination α as functions of time t while treadmill roller-skiing using the skating technique. Notes: Solid line: the skier’s speed v in m/second as a function of time t in seconds. Dashed line: the treadmill’s angle of inclination α in radians as a function of time t in seconds.
Figure 4
Figure 4
Calculations of work rate P and metabolic rates Q as functions of time t in Joules per second (J/s).
Figure 5
Figure 5
Height h as a function of distance s in meters along the track. Notes: ★: 58 height measurement points. Straight lines are drawn between each star, which indicates a piecewise linear track. ■: 16 points where time measurements were made.
Figure 6
Figure 6
Simulated and experimental positions based on height h in meters as a function of time t in seconds along the track while skiing on snow using the skating technique. Notes: Dashed line: P = 253 Joules per second on uphill sections (J/s) and P = 197 J/s on downhill sections. ■: experimental values.
Figure 7
Figure 7
Simulated and experimental positions s in meters as a function of time t in seconds along the track while skiing on snow using the skating technique. Notes: P = 253 Joules per second (J/s) on uphill sections and P = 197 J/s on downhill sections. Dashed line: μ = 0.037; Solid line: μ = 0.037 × 1.1; ■: Experimental values.
Figure 8
Figure 8
Simulated and experimental positions s in meters as a function of time t in seconds along the track while skiing on snow using the skating technique. P = 253 Joules per second (J/s) on uphill sections and P = 197 J/s on downhill sections. Notes: Long-dashed line: CdA = 0.4; Dashed line: CdA = 0.4 1.1; Solid line: CdA = 0.4 × 0.8; ■: experimental values.

Similar articles

Cited by

References

    1. Saltin B. The physiology of competitive c.c. skiing across a four decade perspective; with a note on training induced adaptations and role of training at medium altitude. In: Müller E, Schwameder H, Kornexl E, Raschner C, editors. Science and Skiing. London, UK: E and FN Spon; 1997. pp. 435–469.
    1. Smith GA. Biomechanical analysis of cross-country skiing techniques. Med Sci Sports Exerc. 1992;24(9):1015–1022. - PubMed
    1. Bergh U, Forsberg A. Influence of body mass on cross-country ski racing performance. Med Sci Sports Exerc. 1992;24(9):1033–1039. - PubMed
    1. Norman RW, Komi PV. Mechanical energetics of world-class cross-country skiing. J Appl Biomech. 1987;3:353–369.
    1. Holmberg HC, Rosdahl H, Svedenhag J. Lung function, arterial saturation and oxygen uptake in elite cross country skiers: influence of exercise mode. Scand J Med Sci Sports. 2007;17(4):437–444. - PubMed