

Using auditory classification images for the identification of fine acoustic cues used in speech perception
- PMID: 24379774
- PMCID: PMC3863756
- DOI: 10.3389/fnhum.2013.00865
Using auditory classification images for the identification of fine acoustic cues used in speech perception
Abstract
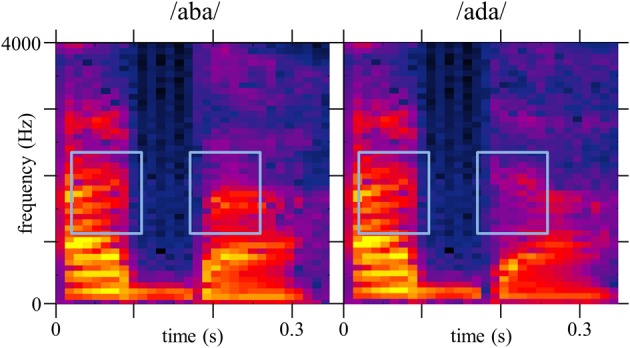
An essential step in understanding the processes underlying the general mechanism of perceptual categorization is to identify which portions of a physical stimulation modulate the behavior of our perceptual system. More specifically, in the context of speech comprehension, it is still a major open challenge to understand which information is used to categorize a speech stimulus as one phoneme or another, the auditory primitives relevant for the categorical perception of speech being still unknown. Here we propose to adapt a method relying on a Generalized Linear Model with smoothness priors, already used in the visual domain for the estimation of so-called classification images, to auditory experiments. This statistical model offers a rigorous framework for dealing with non-Gaussian noise, as it is often the case in the auditory modality, and limits the amount of noise in the estimated template by enforcing smoother solutions. By applying this technique to a specific two-alternative forced choice experiment between stimuli "aba" and "ada" in noise with an adaptive SNR, we confirm that the second formantic transition is key for classifying phonemes into /b/ or /d/ in noise, and that its estimation by the auditory system is a relative measurement across spectral bands and in relation to the perceived height of the second formant in the preceding syllable. Through this example, we show how the GLM with smoothness priors approach can be applied to the identification of fine functional acoustic cues in speech perception. Finally we discuss some assumptions of the model in the specific case of speech perception.
Keywords: GLM; acoustic cues; classification images; phoneme recognition; phonetics; speech perception.
Figures
Similar articles
-
A psychophysical imaging method evidencing auditory cue extraction during speech perception: a group analysis of auditory classification images.PLoS One. 2015 Mar 17;10(3):e0118009. doi: 10.1371/journal.pone.0118009. eCollection 2015. PLoS One. 2015. PMID: 25781470 Free PMC article.
-
Assessment of Spectral and Temporal Resolution in Cochlear Implant Users Using Psychoacoustic Discrimination and Speech Cue Categorization.Ear Hear. 2016 Nov/Dec;37(6):e377-e390. doi: 10.1097/AUD.0000000000000328. Ear Hear. 2016. PMID: 27438871 Free PMC article.
-
Phonetic category recalibration: What are the categories?J Phon. 2014 Jul 1;45:91-105. doi: 10.1016/j.wocn.2014.04.002. J Phon. 2014. PMID: 24932053 Free PMC article.
-
Timing in audiovisual speech perception: A mini review and new psychophysical data.Atten Percept Psychophys. 2016 Feb;78(2):583-601. doi: 10.3758/s13414-015-1026-y. Atten Percept Psychophys. 2016. PMID: 26669309 Free PMC article. Review.
-
Don't force it! Gradient speech categorization calls for continuous categorization tasks.J Acoust Soc Am. 2022 Dec;152(6):3728. doi: 10.1121/10.0015201. J Acoust Soc Am. 2022. PMID: 36586841 Free PMC article. Review.
Cited by
-
Mapping the spectrotemporal regions influencing perception of French stop consonants in noise.Sci Rep. 2024 Nov 8;14(1):27183. doi: 10.1038/s41598-024-77634-w. Sci Rep. 2024. PMID: 39516258 Free PMC article.
-
Direct Viewing of Dyslexics' Compensatory Strategies in Speech in Noise Using Auditory Classification Images.PLoS One. 2016 Apr 21;11(4):e0153781. doi: 10.1371/journal.pone.0153781. eCollection 2016. PLoS One. 2016. PMID: 27100662 Free PMC article.
-
How musical expertise shapes speech perception: evidence from auditory classification images.Sci Rep. 2015 Sep 24;5:14489. doi: 10.1038/srep14489. Sci Rep. 2015. PMID: 26399909 Free PMC article.
-
The sound of trustworthiness: Acoustic-based modulation of perceived voice personality.PLoS One. 2017 Oct 12;12(10):e0185651. doi: 10.1371/journal.pone.0185651. eCollection 2017. PLoS One. 2017. PMID: 29023462 Free PMC article. Clinical Trial.
-
A psychophysical imaging method evidencing auditory cue extraction during speech perception: a group analysis of auditory classification images.PLoS One. 2015 Mar 17;10(3):e0118009. doi: 10.1371/journal.pone.0118009. eCollection 2015. PLoS One. 2015. PMID: 25781470 Free PMC article.
References
-
- Ahumada A. J. (1996). Perceptual classification images from vernier acuity masked by noise. Perception 25(ECVP Suppl.), 18.
-
- Ahumada A., Lovell J. (1971). Stimulus features in signal detection. J. Acoust. Soc. Am. 49, 1751–1756 10.1121/1.1912577 - DOI
LinkOut - more resources
Full Text Sources
Other Literature Sources
Research Materials