Review
. 2013 Dec 13:4:276.
doi: 10.3389/fgene.2013.00276.

Two-phase and family-based designs for next-generation sequencing studies

Affiliations
Review

Two-phase and family-based designs for next-generation sequencing studies

Duncan C Thomas et al. Front Genet. .

Abstract

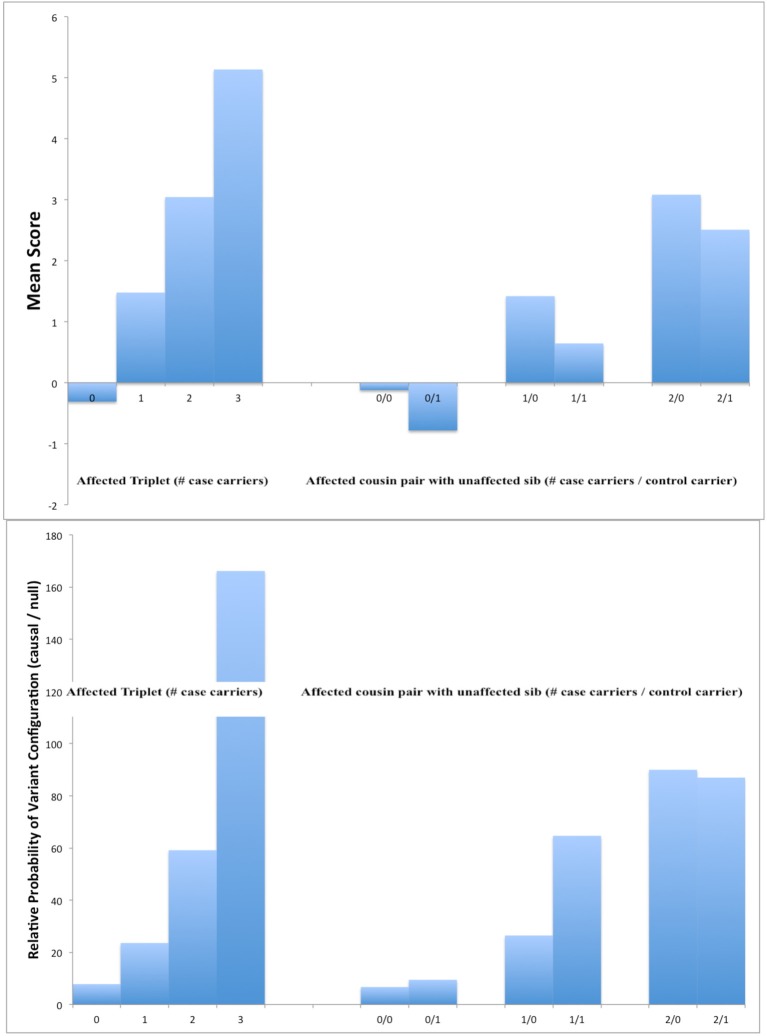
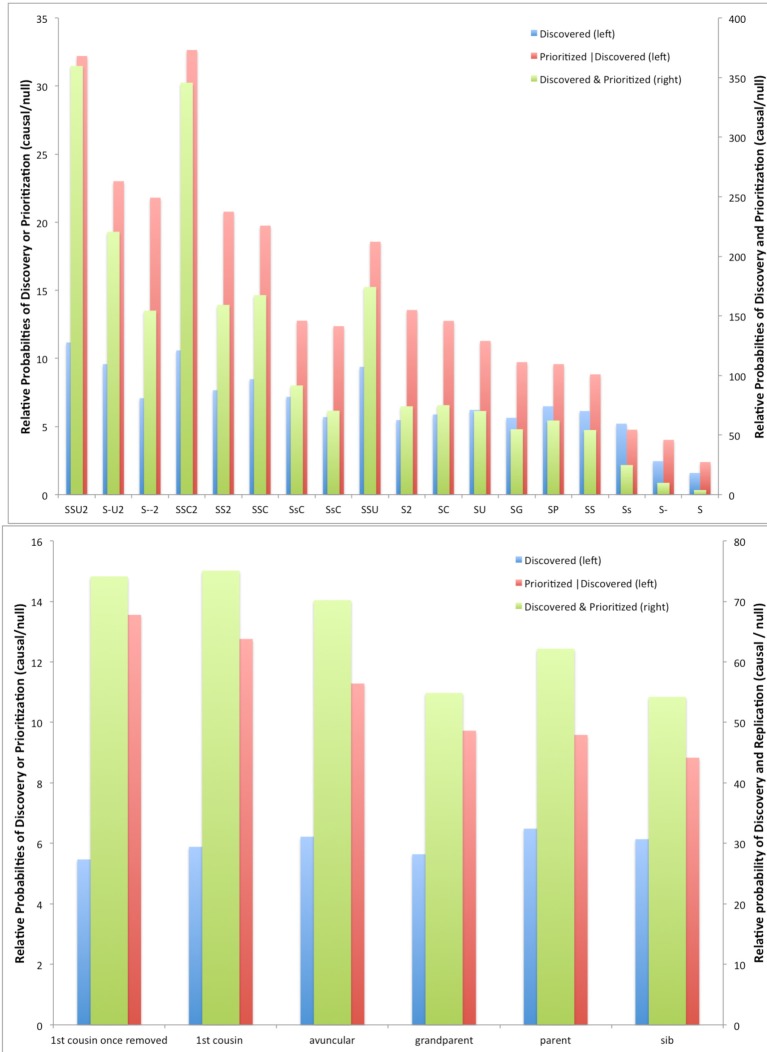
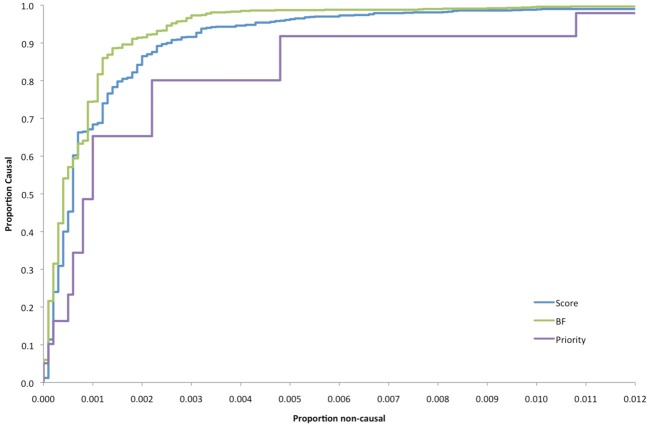
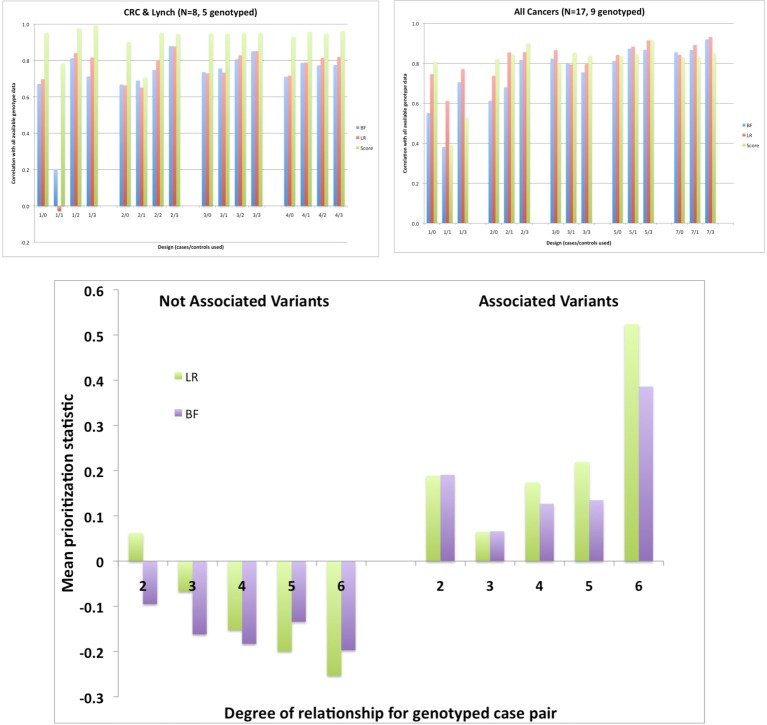
The cost of next-generation sequencing is now approaching that of early GWAS panels, but is still out of reach for large epidemiologic studies and the millions of rare variants expected poses challenges for distinguishing causal from non-causal variants. We review two types of designs for sequencing studies: two-phase designs for targeted follow-up of genomewide association studies using unrelated individuals; and family-based designs exploiting co-segregation for prioritizing variants and genes. Two-phase designs subsample subjects for sequencing from a larger case-control study jointly on the basis of their disease and carrier status; the discovered variants are then tested for association in the parent study. The analysis combines the full sequence data from the substudy with the more limited SNP data from the main study. We discuss various methods for selecting this subset of variants and describe the expected yield of true positive associations in the context of an on-going study of second breast cancers following radiotherapy. While the sharing of variants within families means that family-based designs are less efficient for discovery than sequencing unrelated individuals, the ability to exploit co-segregation of variants with disease within families helps distinguish causal from non-causal ones. Furthermore, by enriching for family history, the yield of causal variants can be improved and use of identity-by-descent information improves imputation of genotypes for other family members. We compare the relative efficiency of these designs with those using unrelated individuals for discovering and prioritizing variants or genes for testing association in larger studies. While associations can be tested with single variants, power is low for rare ones. Recent generalizations of burden or kernel tests for gene-level associations to family-based data are appealing. These approaches are illustrated in the context of a family-based study of colorectal cancer.

Keywords: breast neoplasms; colorectal cancer; family-based study; rare variant association; sequencing; two-phase sampling design.


Figures

Figure 1
Figure 1
Mean scores for causal variants (top panel) and ratio of frequencies of causal to non-causal variants (bottom panel) in simulated 11-member pedigrees with at least 4 affected members. In each panel, results are shown for a design sequencing an affected sib pair and affected cousin by the number of carriers of the variant allele (left) or an affected first cousin pair and an unaffected sib by the number of carriers among cases and controls (right).
Figure 2
Figure 2
Relative probabilities of discovery, prioritization, and both between causal vs. null variants for different criteria for selecting members for sequencing in simulated 11-member pedigrees with at least 4 affected members. Top panel, all designs; bottom panel, detail for designs with only two members sequenced. (Codes for top panel: S, sib; C, cousin; 2, first cousin once removed; U, uncle; G, grandparent; P, parent; Upper case, affected, lower case, unaffected; hyphen, affected but not sequenced.)
Figure 3
Figure 3
Receiver operating curves comparing different prioritization schemes.
Figure 4
Figure 4
Correlation across 32 GWAS SNPs between the statistics computed from the complete genotype data and those computed using only the genotypes for various subsets of members; top left: 5 genotyped CRC and Lynch syndrome cases; top right: 9 cases of any cancer. Bottom: prioritization statistics by degree of relationship for apparently associated or unassociated variants based on the complete data. Data from a single 145-member Australian pedigree with a total of 8 CRC or Lynch syndrome cases and 15 cases of any cancer and a total of 49 subjects genotyped.

References

    1. Asimit J., Zeggini E. (2010). Rare variant association analysis methods for complex traits. Annu. Rev. Genet. 44, 293–308 10.1146/annurev-genet-102209-163421 - DOI - PubMed
    1. Asimit J., Zeggini E. (2012). Imputation of rare variants in next generation association studies. Hum. Hered. 74, 196–204 10.1159/000345602 - DOI - PMC - PubMed
    1. Bacanu S. A., Nelson M. R., Whittaker J. C. (2012). Comparison of statistical tests for association between rare variants and binary traits. PLoS ONE 7:e42530 10.1371/journal.pone.0042530 - DOI - PMC - PubMed
    1. Basu S., Pan W. (2011). Comparison of statistical tests for disease association with rare variants. Genet. Epidemiol. 35, 606–619 10.1002/gepi.20609 - DOI - PMC - PubMed
    1. Begg C. B., Haile R. W., Borg A., Malone K. E., Concannon P., Thomas D. C., et al. (2008). Variation of breast cancer risk among BRCA1/2 carriers. JAMA 299, 194–201 10.1001/jama.2007.55-a - DOI - PMC - PubMed