. 2014 Mar 1;306(5):G425-38.
doi: 10.1152/ajpgi.00368.2013. Epub 2013 Dec 31.

Ostα-/- mice exhibit altered expression of intestinal lipid absorption genes, resistance to age-related weight gain, and modestly improved insulin sensitivity

Affiliations

Ostα-/- mice exhibit altered expression of intestinal lipid absorption genes, resistance to age-related weight gain, and modestly improved insulin sensitivity

Sadie G Wheeler et al. Am J Physiol Gastrointest Liver Physiol. .

Abstract

The organic solute transporter OSTα-OSTβ is a key transporter for the efflux of bile acids across the basolateral membrane of ileocytes and the subsequent return of bile acids to the liver. Ostα(-/-) mice exhibit reduced bile acid pools and impaired lipid absorption. In this study, wild-type and Ostα(-/-) mice were characterized at 5 and 12 mo of age. Ostα(-/-) mice were resistant to age-related weight gain, body fat accumulation, and liver and muscle lipid accumulation, and male Ostα(-/-) mice lived slightly longer than wild-type mice. Caloric intake and activity levels were similar for Ostα(-/-) and wild-type male mice. Fecal lipid excretion was increased in Ostα(-/-) mice, indicating that a defect in lipid absorption contributes to decreased fat accumulation. Analysis of genes involved in intestinal lipid absorption revealed changes consistent with decreased dietary lipid absorption in Ostα(-/-) animals. Hepatic expression of cholesterol synthetic genes was upregulated in Ostα(-/-) mice, showing that increased cholesterol synthesis partially compensated for reduced dietary cholesterol absorption. Glucose tolerance was improved in male Ostα(-/-) mice, and insulin sensitivity was improved in male and female Ostα(-/-) mice. Akt phosphorylation was measured in liver and muscle tissue from mice after acute administration of insulin. Insulin responses were significantly larger in male and female Ostα(-/-) than wild-type mice. These findings indicate that loss of OSTα-OSTβ protects against age-related weight gain and insulin resistance.

Keywords: bile acids; glucose tolerance; insulin sensitivity; lipid absorption; organic solute transporter.


Figures
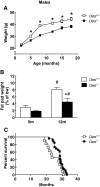
Fig. 1.
Fig. 1.
Age-related weight gain is less rapid in male organic solute transporter (OST)-deficient (Ostα−/−) mice. A: body weight of male mice from 2 to 18 mo of age (n = 4–44). B: combined weight of gonadal and perirenal fat pads from 5-mo-old (5m) and 12-mo-old (12m) mice (n = 10–16). Values are means ± SE. *P < 0.05 vs. wild-type (Ostα+/+). #P < 0.05 vs. 5m. C: age of mice at the time of death (n = 16–49). Median ages of wild-type and Ostα−/− mice at time of death were 23.60 and 28.65 mo, respectively (P < 0.05).
Fig. 2.
Fig. 2.
Age-related weight gain is less rapid in female Ostα−/− mice. A: body weight of female mice from 2 to 15 mo of age (n = 6–52). B: combined weight of gonadal and perirenal fat pads from 5- and 12-mo-old mice (n = 14–23). bw, Body weight. Values are means ± SE. *P < 0.05 vs. wild-type. C: age of mice at the time of death (n = 6–12). Median ages of wild-type and Ostα−/− mice at time of death were 26.00 and 27.10 mo, respectively [P = not significant (NS)].
Fig. 3.
Fig. 3.
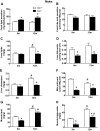
Male Ostα−/− mice excrete more lipid and have lower liver lipids and bile acids. A and B: total lipids and bile acids in feces collected from 5- and 12-mo-old mice over 48 h. In A and B, Ostα−/− mice ate more than wild-type mice (4.2 ± 0.2 vs. 3.7 ± 1.2 g/day at 5 mo and 4.4 ± 0.3 vs. 3.1 ± 0.4 g/day at 12 mo). C and D: total lipids and bile acids in liver samples from 5- and 12-mo-old animals expressed relative to wet weight (ww). E and F: liver cholesterol and bile acid levels in liver, gallbladder, and small intestine from 5- and 12-mo-old mice. G and H: total lipids and triglycerides in skeletal muscle from 5- and 12-mo-old animals. Values are means ± SE (n = 6–12). *P < 0.05 vs. wild-type. #P < 0.05 vs. 5m.
Fig. 4.
Fig. 4.
Female Ostα−/− mice excrete more lipid and have lower liver lipids. A and B: total lipids and bile acids in feces collected from 5- and 12-mo-old mice over 48 h. C and D: total lipids and bile acids in liver samples from 5- and 12-mo-old animals. E and F: liver cholesterol and bile acid levels in liver, gallbladder, and small intestine from 5- and 12-mo-old mice. G and H: total lipids and triglycerides in skeletal muscle from 5- and 12-mo-old animals. Values are means ± SE (n = 6–12). *P < 0.05 vs. wild-type. #P < 0.05 vs. 5m.
Fig. 5.
Fig. 5.
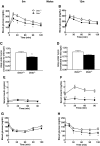
Male Ostα−/− mice have improved glucose tolerance and insulin sensitivity. Glucose tolerance tests were performed in 5-mo-old (A, C, and E) and 12-mo-old (B, D, and F) animals following an overnight fast. Glucose (1 mg/g ip) was administered, and tail blood was analyzed for glucose at 15- to 30-min intervals. In E and F, additional blood was collected from tail snips at 0, 30, 60, and 90 min for insulin analysis. G and H: insulin tolerance tests in 5- and 12-mo-old animals following a 6-h fast. Insulin (1.5 U/kg ip) was administered, and tail blood was analyzed for glucose at 15- to 30-min intervals. Body weights of 5-mo-old wild-type and Ostα−/− mice were 28 ± 4 and 29 ± 3 g, respectively, whereas 12-mo-old wild-type and Ostα−/− mice weighed 39 ± 5 and 31 ± 3 g, respectively. C and D: total area under the curve relative to wild-type mice. Values are means ± SE (n = 9–12). *P < 0.05 vs. wild-type.
Fig. 6.
Fig. 6.
Glucose tolerance and insulin sensitivity in female mice. Glucose tolerance tests were performed in 5-mo-old (A, C, and E) and 12-mo-old (B, D, and F) mice following an overnight fast. Glucose (1 mg/g ip) was administered, and tail blood was analyzed for glucose at 15- to 30-min intervals. In E and F, additional blood was collected from tail snips at 0, 30, 60, and 90 min for insulin analysis. G and H: insulin tolerance tests in 5- and 12-mo-old mice following a 6-h fast. Insulin (1.5 U/kg ip) was administered, and tail blood was analyzed for glucose at 15- to 30-min intervals. Body weights of 5 mo-old wild-type and Ostα−/− mice were 28 ± 4 and 23 ± 2 g, respectively, whereas 12-mo-old wild-type and Ostα−/− mice weighed 30 ± 3 and 25 ± 2 g, respectively. C and D: total area under the curve relative to wild-type mice. Values are means ± SE (n = 9–10). *P < 0.05 vs. wild-type.
Fig. 7.
Fig. 7.
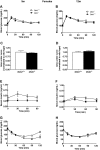
Cholic acid-enriched diet restores fecal lipid absorption in male Ostα−/− mice. Male 12-mo-old wild-type and Ostα−/− mice were fed a diet enriched with 0.2% cholic acid. AC: fecal lipid excretion was measured (n = 5; A) and glucose tolerance tests (n = 9–11) were performed before (B) and 1 wk after (C) the animals were switched to the cholic acid-enriched diet (n = 5). D and E: insulin levels during the glucose tolerance tests. Values are means ± SE. *P < 0.05 vs. wild-type.
Fig. 8.
Fig. 8.
Insulin-induced phosphorylated Akt (p-Akt) and total Akt expression in liver and muscle tissue from male mice. Male 12-mo-old wild-type and Ostα−/− mice were fasted overnight. At 10 min after intraperitoneal injection of insulin (1.5 U/kg) or saline, liver (A) and muscle (B) tissue were removed, and Akt phosphorylation was analyzed by Western blotting. Graphs represent densitometric values of p-Akt-to-Akt expression ratio relative to average insulin-stimulated wild-type p-Akt-to-Akt ratio. Values are means ± SE (n = 6, each analyzed 3 separate times). *P < 0.05.
Fig. 9.
Fig. 9.
Insulin-induced p-Akt and Akt expression in liver and muscle tissue of female mice. Female 12-mo-old wild-type and Ostα−/− mice were fasted overnight. At 10 min after intraperitoneal injection of insulin (1.5 U/kg) or saline, liver (A) and muscle (B) tissue were removed, and Akt phosphorylation was analyzed by Western blotting. Graphs represent densitometric values of p-Akt-to-Akt expression ratio relative to average insulin-stimulated wild-type p-Akt-to-Akt ratio. Values are means ± SE (n = 4–5, analyzed 3 separate times). *P < 0.05.
Fig. 10.
Fig. 10.
Age-independent phenotype of Ostα−/− mice (left) and age-related changes in wild-type and Ostα−/− mice (right). In Ostα−/− mice, lower concentrations of bile acids (BA) impair absorption of dietary lipids (○) in the small intestine. Lipid transporters in enterocytes are depicted in the cell at left and bile acid transporters in the cell at right. Differences in expression of genes encoding transporters are shown schematically by font size. ABCA1, ATP-binding cassette transporter 1; SRB1, scavenger receptor class B type 1; NPC1L1, Niemann-Pick C1-like 1; MRP3, multidrug resistance-associated protein 3.

References

    1. Ballatori N, Fang F, Christian WV, Li N, Hammond CL. Ostα-Ostβ is required for bile acid and conjugated steroid disposition in the intestine, kidney, and liver. Am J Physiol Gastrointest Liver Physiol 295: G179–G186, 2008 - PMC - PubMed
    1. Ballatori N, Li N, Fang F, Boyer JL, Christian WV, Hammond CL. OSTα-OSTβ: a key membrane transporter of bile acids and conjugated steroids. Front Biosci 14: 2829–2844, 2009 - PMC - PubMed
    1. Bou Khalil M, Blais A, Figeys D, Yao Z. Lipin: the bridge between hepatic glycerolipid biosynthesis and lipoprotein metabolism. Biochim Biophys Acta 1801: 1249–1259, 2010 - PubMed
    1. Christian WV, Li N, Hinkle PM, Ballatori N. β-Subunit of the Ostα-Ostβ organic solute transporter is required not only for heterodimerization and trafficking but also for function. J Biol Chem 287: 21233–21243, 2012 - PMC - PubMed
    1. Dawson PA, Hubbert ML, Rao A. Getting the mOST from OST: role of organic solute transporter, OSTα-OSTβ, in bile acid and steroid metabolism. Biochim Biophys Acta 1801: 994–1004, 2010 - PMC - PubMed

Publication types

MeSH terms

Substances

LinkOut - more resources