. 2014 Feb 28;289(9):5925-37.
doi: 10.1074/jbc.M113.516617. Epub 2013 Dec 31.

A 130-kDa protein 4.1B regulates cell adhesion, spreading, and migration of mouse embryo fibroblasts by influencing actin cytoskeleton organization

Affiliations

A 130-kDa protein 4.1B regulates cell adhesion, spreading, and migration of mouse embryo fibroblasts by influencing actin cytoskeleton organization

Jie Wang et al. J Biol Chem. .

Abstract

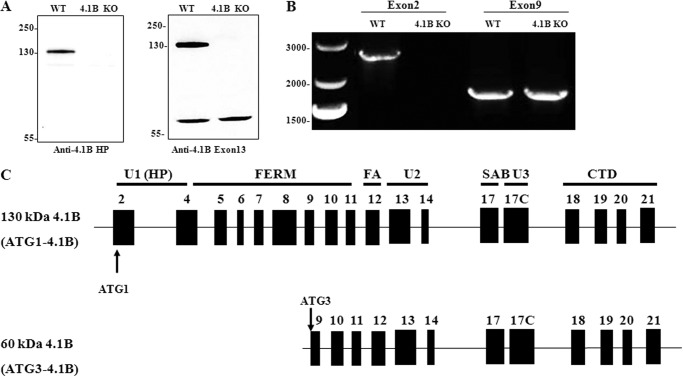
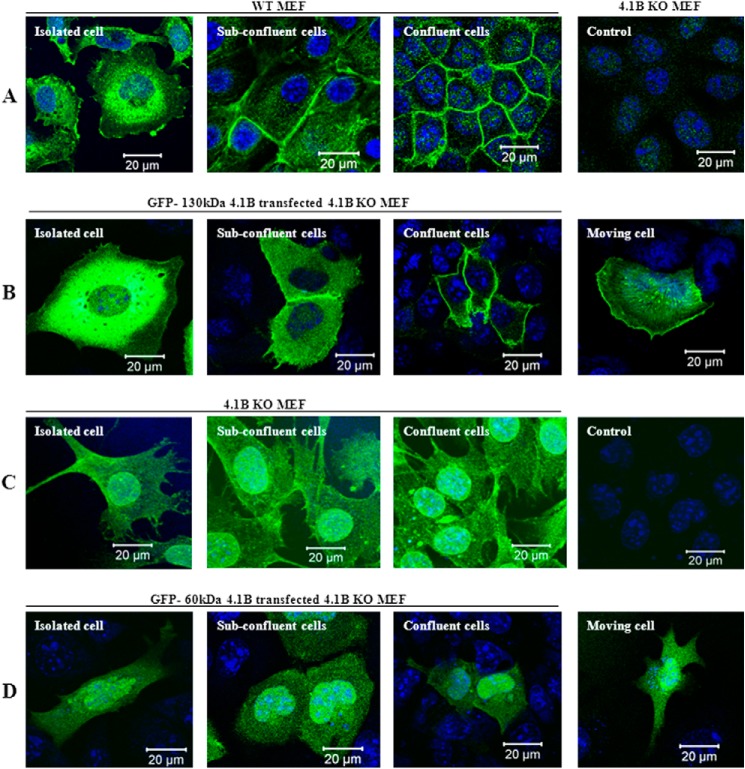
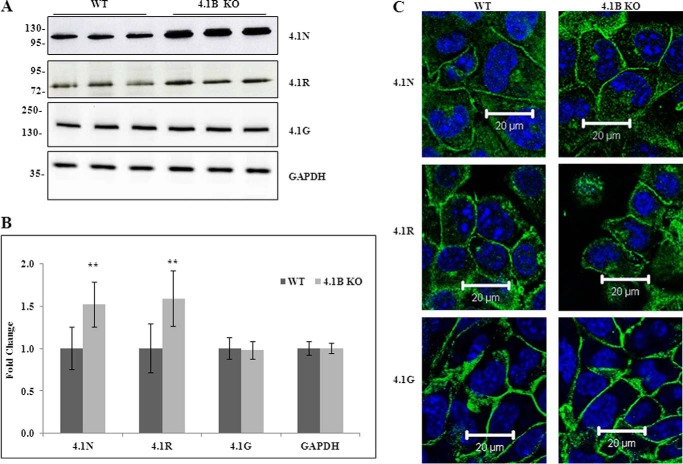
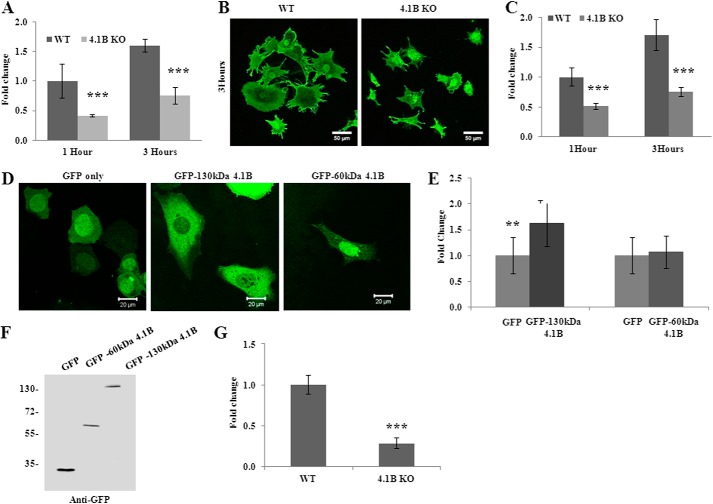
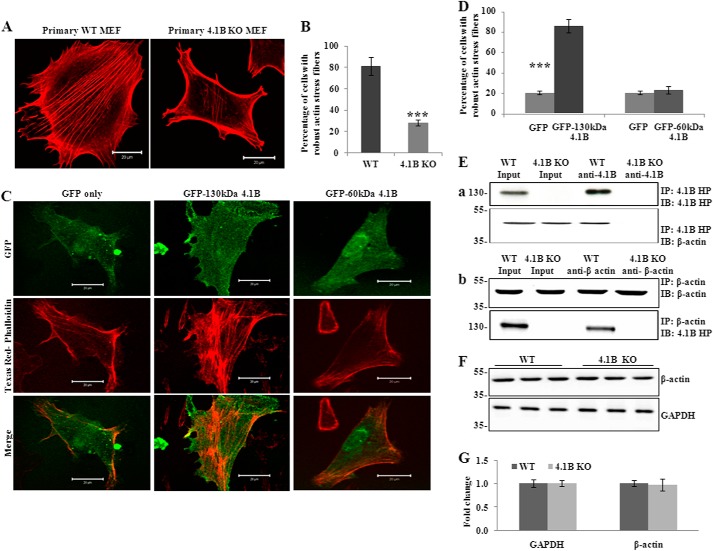
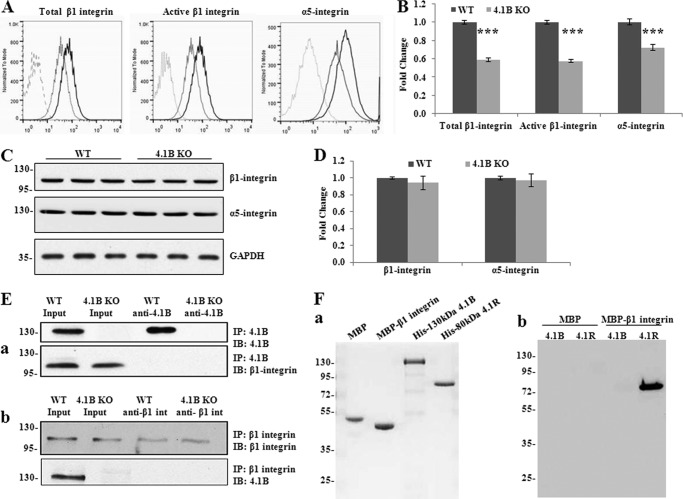
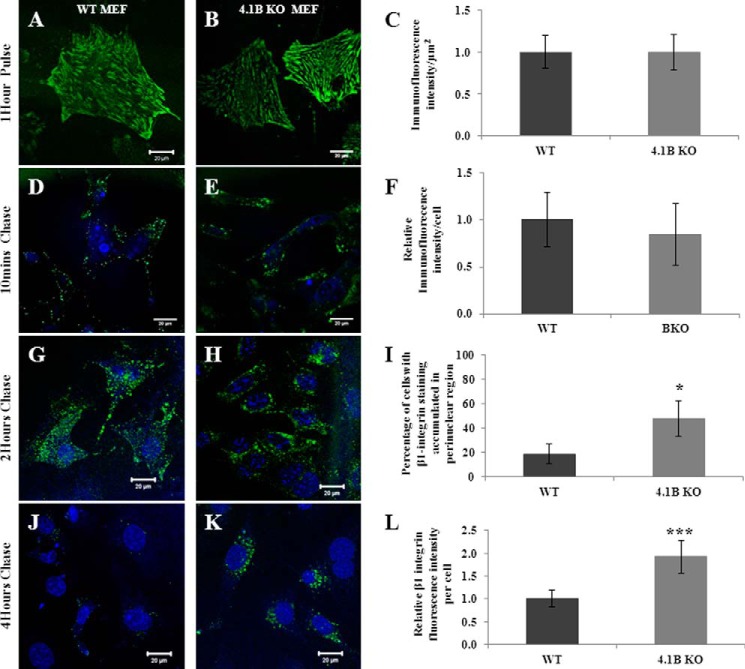
Protein 4.1B is a member of protein 4.1 family, adaptor proteins at the interface of membranes and the cytoskeleton. It is expressed in most mammalian tissues and is known to be required in formation of nervous and cardiac systems; it is also a tumor suppressor with a role in metastasis. Here, we explore functions of 4.1B using primary mouse embryonic fibroblasts (MEF) derived from wild type and 4.1B knock-out mice. MEF cells express two 4.1B isoforms: 130 and 60-kDa. 130-kDa 4.1B was absent from 4.1B knock-out MEF cells, but 60-kDa 4.1B remained, suggesting incomplete knock-out. Although the 130-kDa isoform was predominantly located at the plasma membrane, the 60-kDa isoform was enriched in nuclei. 130-kDa-deficient 4.1B MEF cells exhibited impaired cell adhesion, spreading, and migration; they also failed to form actin stress fibers. Impaired cell spreading and stress fiber formation were rescued by re-expression of the 130-kDa 4.1B but not the 60-kDa 4.1B. Our findings document novel, isoform-selective roles for 130-kDa 4.1B in adhesion, spreading, and migration of MEF cells by affecting actin organization, giving new insight into 4.1B functions in normal tissues as well as its role in cancer.

Keywords: Actin; Adhesion; Cytoskeleton; Membrane; Migration.


Figures

FIGURE 1.
FIGURE 1.
Expression of 4.1B in MEF cells. A, immunoblot analysis of 4.1B expression in WT and 4.1B KO MEF cells. 40 μg of protein lysates were probed with polyclonal rabbit antibody against 4.1B head piece or 4.1B Exon 13. B, amplification of 4.1B cDNAs from MEF cells. The ATG1 or ATG3 4.1B transcripts were amplified as described under “Experimental Procedures.” Sizes of each PCR product, expressed in base pair (bp), are indicated. C, exon maps and protein structure of MEF cell 4.1B. Translation initiation sites are indicated (ATG-1, ATG-3). Domains are shown as described in the Introduction.
FIGURE 2.
FIGURE 2.
Localization of 4.1B in MEF cells. A, localization of endogenous 130-kDa 4.1B. MEF cells were cultured on fibronectin-coated surface to reach different confluent conditions as indicated. The cells were then fixed and stained using anti-4.1B HP antibody. 4.1B KO MEF cells were used as the negative control. B, localization of exogenously transfected GFP-130-kDa 4.1B. GFP-130-kDa 4.1B was transiently expressed in 4.1B KO MEF cells. The cells were cultured as described, then fixed. The images were taken using confocal microscopy. C, localization of endogenous 60-kDa 4.1B. 4.1B KO MEF cells were cultured on fibronectin-coated surface to reach different confluent conditions as indicated. The cells were then fixed and stained using anti-4.1B exon 13 antibody. Cells stained with secondary antibody only were used as a negative control. D, localization of exogenously transfected GFP-60-kDa 4.1B. GFP-60-kDa-4.1B was transiently expressed in 4.1B KO MEF cells. The cells were cultured as described, then fixed. The images were taken using confocal microscopy. All pictures were taken with oil-immersed 63× objective. Scale bar, 20 μm.
FIGURE 3.
FIGURE 3.
Expression and localization of 4. 1N, 4.1R, and 4.1G in WT and 4.1B KO MEF cells. A, immunoblot analysis. Total lysates (40 μg protein) were probed with antibodies against 4.1N HP, 4.1R exon13, and 4.1G HP. GAPDH was used as the loading control. B, quantitative analysis of immunoblot. The results from three independent experiments were shown. **, p < 0.01. C, immunofluorescence staining. Cells were cultured on fibronectin-coated surface. One day after the cells reached confluence, the cells were fixed and stained using antibodies as indicated. All pictures were taken with oil-immersed 63× objective. Scale bar, 20 μm.
FIGURE 4.
FIGURE 4.
Impaired adhesion, spreading, and migration of 4.1B KO MEF cells. A, cell adhesion. Cells were plated on fibronectin-coated 96-well plates and incubated for 1 or 3 h. The adherent cells were stained with crystal violet, and the staining intensity was quantified by spectrophotometry at 560 nm. The quantitative analysis from three independent experiments was shown. ***, p < 0.001. B, cell spreading. Cells were seeded and allowed to spread for 1 or 3 h. The cells were labeled with Alexa Fluor 488-conjugated wheat germ agglutinin, and the images were collected by Zeiss confocal microscope. The representative pictures of cells that were allowed to spread for 3 h were shown. Pictures were taken with a 25× objective. Scale bars, 20 μm. C, quantitative analysis of cell spreading. The mean surface area from 45 cells of each type was calculated using LSM 5 Pascal software. ***, p < 0.001. D and E, rescue of impaired cell spreading. 4.1B KO MEF cells were transiently transfected with GFP, GFP-130-kDa 4.1B, or GFP-60-kDa 4.1B. The cell spreading after 3 h was measured as described above. D, representative images. E, quantitative analysis from 30 cells of each type was shown. **, p < 0.01. Pictures were taken with an oil-immersed 63× objective. Scale bars, 20 μm. F, immunoblot analysis of transfected 4.1B. 40 μg of cell lysates were probed with polyclonal rabbit antibody against GFP. G, Transwell assay. 8-μm-diameter pore transwell cell culture inserts were placed in 6-well plates, and the bottom surface of insert was coated with fibronectin. 5 × 10⁵ were seeded on top of the insert and incubated for 8 h. The cells migrated to the bottom of the well were fixed and stained with crystal violet, and cell numbers were counted. The averages from three experiments are shown. ***, p < 0.001.
FIGURE 5.
FIGURE 5.
130kDa-4.1B is required for actin stress fiber formation in MEF cells. A and B, endogenous actin filament staining. Cells were cultured on the fibronectin-coated surface and stained with Texas Red-phalloidin. The quantitative analysis from 50 cells of each cell type is shown in B. ***, p < 0.001. All pictures were taken with oil-immersed 63× objective. Scale bars, 20 μm. C and D, rescue of actin stress fiber formation by GFP-130-kDa 4.1B. 4.1B KO MEF cells were transfected with GFP, GFP-130-kDa 4.1B, or GFP-60-kDa 4.1B. Cells were stained with Texas Red-phalloidin. The quantitative analysis from 30 cells of each cell type is shown in D. ***, p < 0.001. All pictures were taken were taken with oil-immersed 63× objective. Scale bars, 20 μm. E, immunoprecipitation (IP). a, 130-kDa 4.1B was immunoprecipitated from MEF cells using anti-4.1B HP antibody. 130-kDa 4.1B or actin in the immunoprecipitate was detected using anti-4.1B HP antibody or anti-actin antibody. b, actin was immunoprecipitated from MEF cells using anti-actin antibody. Actin or 130-kDa 4.1B in the immunoprecipitate was detected using the indicated antibodies. IB, immunoblot. F and G, immunoblot analysis of actin. 20 μg of cell lysates were probed with anti-actin antibody. A GAPDH immunoblot is shown as a loading control (F). Quantitative analysis from three independent experiments is shown in G.
FIGURE 6.
FIGURE 6.
Decreased surface expression and activity of β1 integrin accompanied with the loss of surface α5 integrin in 4.1B KO MEF cells. A and B, surface expression of β1 and α5 integrin. The representative profiles and quantitative analysis from three independent experiments are shown in A and B, respectively. Black line, WT; light gray, 4.1B KO; broken line, unstained. ***, p < 0.001. C and D, immunoblot analysis of β1 and α5 integrin. 40 μg of cell lysates were probed with anti-β1 integrin antibody and α5 integrin, respectively. GAPDH was used as the loading control (C). Quantitative analysis from three independent experiments was shown in D. E, immunoprecipitation (IP). a, 130-kDa 4.1B was immunoprecipitated from MEF cells using anti-4.1B HP antibody. 130-kDa 4.1B or β1 integrin in the immunoprecipitate was detected using anti-4.1B HP antibody or anti-β1 integrin antibody. IB, immunoblot. b, β1 integrin was immunoprecipitated from MEF cells using anti-β1 integrin antibody. β1 integrin or 130-kDa 4.1B in the immunoprecipitate was detected using the indicated antibodies. F, in vitro pulldown assay for β1 integrin-4.1B interaction. a, proteins used in the binding assays. 2 μg of each affinity-purified recombinant protein was separated by 10% SDS-PAGE and stained with Gel Blue; from the left, as indicated: MBP, MBP-β1 integrin cytoplasmic domain fusion protein, His-tagged 130-kDa 4.1B, His-tagged 80 kDa 4.1R. b, analysis of binding. His-tagged constructs of 4.1B or 4.1R, as in a, were mixed with either MBP or MBP-β1 integrin cytoplasmic domain. The mixtures were incubated with amylose beads and centrifuged to recover bound complexes as described under “Experimental Procedures.” Bound complexes were removed from the beads by washing with SDS, and they were analyzed by SDS-PAGE and immunoblotting with anti-His tag antibody. Note that MPB-β1 integrin cytoplasmic domain binds to 4.1R but not 4.1B and that neither 4.1 protein binds MBP alone.
FIGURE 7.
FIGURE 7.
Impaired β1 integrin trafficking in 130-kDa 4.1B-deficient MEF cells. A–C, pulse phase. MEF cells were pulse-labeled with 9EG7 monoclonal antibody for 1 h at 4 °C. Quantitative analysis was from 50 cells of each type. D–F, the internalized β1 integrin after 10 min chase. After a 10-min chase, the cells were quenched, and internalized β1 integrin were visualized. Quantitative analysis was from 50 cells of each type. G–I, the internalized β1 integrin after 2 h chase. After a 2-h chase, the cells were quenched, and internalized β1 integrin were visualized. Quantitative analysis was from 50 cells of each type. *, p < 0.05. J–L, the internalized β1 integrin after 4 h chase. Cells were treated with same procedures after a 4-h chase as described above. The fluorescence intensity of the cells (50 cells of each type) were measured and quantified using Image J. ***, p < 0.001. All pictures were taken with a 25× objective. Scale bars, 20 μm. Note that a single exposure setting was used for all fluorescence quantifications.

References

    1. Baines A. J., Lu H.-C., Bennett P. M. (2014) The Protein 4.1 family. Hub proteins in animals for organizing membrane proteins. Biochim. Biophys. Acta 1838, 605–619 - PubMed
    1. Baines A. J. (2010) The spectrin-ankyrin-4.1-adducin membrane skeleton. Adapting eukaryotic cells to the demands of animal life. Protoplasma 244, 99–131 - PubMed
    1. Mohandas N., Gallagher P. G. (2008) Red cell membrane. Past, present, and future. Blood 112, 3939–3948 - PMC - PubMed
    1. Peters L. L., Weier H. U., Walensky L. D., Snyder S. H., Parra M., Mohandas N., Conboy J. G. (1998) Four paralogous protein 4.1 genes map to distinct chromosomes in mouse and human. Genomics 54, 348–350 - PubMed
    1. Parra M., Gee S., Chan N., Ryaboy D., Dubchak I., Mohandas N., Gascard P. D., Conboy J. G. (2004) Differential domain evolution and complex RNA processing in a family of paralogous EPB41 (protein 4.1) genes facilitate expression of diverse tissue-specific isoforms. Genomics 84, 637–646 - PubMed

Publication types

MeSH terms