. 2014 Jan 1;34(1):66-78.
doi: 10.1523/JNEUROSCI.3371-13.2014.

MicroRNA-132 is enriched in developing axons, locally regulates Rasa1 mRNA, and promotes axon extension

Affiliations

MicroRNA-132 is enriched in developing axons, locally regulates Rasa1 mRNA, and promotes axon extension

Melissa L Hancock et al. J Neurosci. .

Abstract

Developing axons can locally synthesize proteins, with roles in axon growth, guidance, and regeneration, but the mechanisms that regulate axonal mRNA translation are not well understood. MicroRNAs (miRNAs) are important regulators of translation but have still been little characterized in developing axons. Here we study mouse dorsal root ganglion (DRG) axons and show that their extension is impaired by conditional deficiency of the miRNA-processing enzyme Dicer in vitro and in vivo. A screen for axonal localization identifies a specific set of miRNAs preferentially enriched within the developing axon. High axonal expression and preferential localization were observed for miR-132, a miRNA previously known for roles in dendrites and dysregulation in major neurologic diseases. miR-132 knockdown reduced extension of cultured DRG axons, whereas overexpression increased extension. Mechanistically, miR-132 regulated the mRNA for the Ras GTPase activator Rasa1, a novel target in neuronal function. Moreover, miR-132 regulation of Rasa1 translation was seen in severed axons, demonstrating miRNA function locally within the axon. miR-132 expression in DRGs peaked in the period of maximum axon growth in vivo, consistent with its effect on axon growth, and suggesting a role as a developmental timer. Together, these findings identify miR-132 as a positive regulator of developing axon extension, acting through repression of Rasa1 mRNA, in a mechanism that operates locally within the axon.

Keywords: axon development; local mRNA translation; microRNA.


Figures
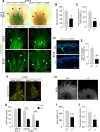
Figure 1.
Figure 1.
Dicer conditional gene deletion results in DRG axon defects. A, Whole-mount LacZ staining of Dicer+/+;Wnt1+/Cre;R26R+/− or Dicer flox/flox;Wnt1+/Cre;R26R+/− embryos at E13.5 (top) and peripherin immunolabeling of Dicer+/+Wnt1+/Cre (+/+) or Dicerflox/floxWnt1+/Cre (−/−) embryos at E12.5 and E13.5 (bottom) revealed stunted and aberrant axon extension in mutant paws. Arrows mark examples of nerve endings. Scale bar, 100 μm. B, Quantitation of peripherin+ nerve endings per paw in whole mounts of E13.5 embryos. C, Quantitation of total nerve innervation of paws. The percentage of paw area innervated by peripherin+ nerves was calculated by dividing the total area of peripherin+ immunofluorescence (IF) by the total area of the paw. D, Transverse sections of hindlimb epithelium labeled for peripherin (green) and DAPI nuclear label (blue) at E13.5. Scale bar, 50 μm. E, Quantitation of peripherin+ nerve endings per 100 μm terminating in epidermis. F, Transverse sections of DRG from E15.5 Dicer (+/+) or (−/−) embryos were colabeled for Islet 1/2 and TrkA. Scale bar, 100 μm. G, Quantitation of Islet1/2+ or TrkA+ DRG neurons per section. H, DRG explants from E13.5 (+/+) or (−/−) embryos were cultured for 36 h and labeled for NF-M. Scale bar, 100 μm. I, Quantitation of average DRG axon length. J, Quantitation of axon extension rate with DIC time-lapse microscopy. Bar graphs shown as means ± SEM. *p < 0.05; **p < 0.01; ***p < 0.001 (t test).
Figure 2.
Figure 2.
Screen for miRNAs in DRG neurons and axons. A, Cultured DRG axons were immunolabeled for Dicer or Ago2 (green). F-actin is labeled with phalloidin (blue), and growth cones are outlined (white line). Scale bar, 10 μm. B, E13.5 DRG explants were cultured in AXIS multicompartment microfluidic chambers (Millipore), which have been used previously to isolate axons (Willis and Twiss, 2011). The explants were plated in one compartment, and axons extended through ≥150 μm microgrooves to an axon compartment. After 3 d in culture, neurons were labeled with NF-M to identify axons and nuclei were labeled with DAPI. Dashed lines demarcate the boundaries of the total neuron (left) and axon (right) compartments. The microgrooves are present in the middle region; reduced antibody diffusion through the microgrooves prevented strong labeling in this region. Scale bar, 50 μm. C, Verification of axon purity by qRT-PCR. Total RNA was extracted from total neuron or axon compartments, and β-actin and γ-actin mRNA levels were measured by qRT-PCR. Axonal mRNA was devoid of γ-actin mRNA, which is only present in the soma. Results shown as means ± SEM. ***p < 0.001 (t test). D, Expression levels of miRNA measured by qRT-PCR rodent TLDA. Results are displayed as a heat map of miRNA enrichment in axon relative to total neuron, on a logarithmic scale (green is axonally enriched, and red is axonally depleted). In this experiment, miRNA values were normalized by the average value for all detected miRNA in the sample (see Materials and Methods for details). E, Expression levels of miRNAs in axon and whole neuron (total) populations, measured by qRT-PCR TLDA. Results are displayed as a heat map in which increasing green intensity indicates higher expression levels, displayed as a percentage of total miRNA expression in each population (axon or total neuron). miRNAs are ranked by axonal expression level (n = 4).
Figure 3.
Figure 3.
miRNAs enriched in axons and reduced in Dicer mutant neurons. A, Expression levels of miRNA from Dicer+/+Wnt1+/Cre (+/+) or Dicerflox/floxWnt1+/Cre (−/−) DRGs at E12.5 measured by qRT-PCR TLDA. Results are displayed as a heat map of miRNA expression in the Dicer mutant relative to control, on a logarithmic scale. The degree of miRNA depletion in the Dicer mutant is denoted by red intensity; miRNAs with no detectable (n.d.) expression in the mutant are indicated in light pink. B, Venn diagram of miRNAs reduced in Dicer (−/−) DRGs (red) or enriched in axons (green). C, Verification of Dicer knock-out TLDA results by qRT-PCR, showing miR-132 reduction by 80% in Dicer mutant DRGs (normalized to snoRNA202; n ≥ 3 DRG per genotype). D, Verification of TLDA results by qRT-PCR, showing axonal enrichment of miR-132. Mature miR-132 levels (normalized here to U6, to facilitate comparison with previous studies that have used U6 for normalization of axonal distributions; see Materials and Methods for details) are displayed as enrichment relative to total neuron (>13-fold), where total neuron level equals 1 (n = 4). E, Quantitation of pre-miR-132 levels (normalized to miR-125a–5p) by qRT-PCR in isolated axon and total neuron populations. Axonal pre-miR-132 levels are displayed as enrichment relative to total neuron (>45-fold), where total neuron level equals 1 (n = 4). miR-125a–5p levels were used for normalization here, since our qRT-PCR TLDA results (using the average miRNA normalization method) revealed that miR-125a–5p was approximately equally expressed in the axon and total cell; see Materials and Methods for details. F, Quantitation of precursor and mature miR-132 levels (both normalized to miR-125a–5p) by qRT-PCR in isolated axons and total neuron populations. Levels are displayed relative to total neuron, where total neuron level equals 1 (n = 4). G, Images of in situ hybridization with LNA probes show the presence of miR-132 labeling in axons and growth cones (arrows), as well as the absence of miRNA signal with control LNA probes. Scale bar, 10 μm. H, Quantitation of miR-132 LNA AFI in axons. Bar graphs shown as means ± SEM. *p < 0.05; **p < 0.01; ***p < 0.001 (t test).
Figure 4.
Figure 4.
miR-132 regulates axon extension. A, Temporal profile of miR-132 levels (normalized to snoRNA61) by qRT-PCR in DRGs at different ages. Results shown are fold-changes relative to levels at E12.5 (n ≥ 3 pups per age). B, Temporal profile of miR-125a–5p expression (normalized to snoRNA61) by qRT-PCR in E13.5, E15.5, and E17.5 DRGs. Results shown are fold-changes relative to levels at E13.5 (n ≥ 3 pups per age). C, E13.5 Dicer+/+Wnt1+/Cre DRG neurons were electroporated with miRNA mimics or inhibitors, together with a GFP-reporter, and cultured for 24 h. DRG neurons from Dicerflox/floxWnt1+/Cre (Dicer −/−) were cultured in parallel and labeled for NF-M. Scale bar, 50 μm. D, Quantitation of axon length from C (n > 100 GFP+ axons per condition and n = 24 for Dicer −/− axons). Bar graphs shown as means ± SEM. *p < 0.05; **p < 0.01; ***p < 0.001; n.s., not significant (t test for A, B; ANOVA with Tukey's HSD post hoc test for D).
Figure 5.
Figure 5.
miR-132 targets Rasa1 mRNA in neurons. A, Venn diagram of mRNAs predicted to be targets of miR-132 by the TargetScan algorithm (green); mRNAs downregulated in cells expressing miR-132 mimic (Grimson et al., 2007; NCBI GEO database accession number GSE8501; purple); and mRNAs expressed in embryonic axons (Zivraj et al., 2010; blue). B, Quantitation of Rasa1 and Crk1 mRNA levels (normalized to Gapdh) in isolated DRG axons and total neurons by qRT-PCR. C, Quantitation of Rasa1 mRNA expression (normalized to Gapdh) in DRG from E12.5 Dicer+/+Wnt1+/Cre (+/+) or Dicerflox/floxWnt1+/Cre (−/−) embryos by qRT-PCR. D, Western blot of endogenous Rasa1 protein levels in DRG neurons treated with control, miR-132, or miR-29a PNA inhibitors for 2 d. E, Quantitation of Rasa1 mRNA expression (normalized to Gapdh) by qRT-PCR in DRG neurons treated with control or miR-132 PNA inhibitors for 2 d (n = 3). F, Neuro2A cells expressing control, miR-132, or miR-150 inhibitors, together with a reporter with the 3′UTR of Rasa1 mRNA downstream of a firefly luciferase region. Shown is firefly luciferase activity normalized to Renilla luciferase control (n = 3). G, Quantitation of Rasa1 mRNA levels (normalized to Gapdh) by qRT-PCR in Neuro2A cells transfected with control or miR-132 mimics for 2 d (n = 4). H, miR-132 mimic was cotransfected with a TP designed to block the predicted miR-132 binding site within Rasa1 3′UTR (Rasa1-TP) or scrambled control TP (con-TP) in Neuro2A cells, and Rasa1 or Crk1 mRNA levels (normalized to Gapdh) were measured by qRT-PCR. Rasa1-TP, compared with control TP, promoted rescue of the effect of miR-132 mimic on Rasa1 mRNA, whereas Rasa1-TP did not affect the level of Crk1 mRNA, another miR-132 target. I, Quantitation of Rasa1 mRNA levels (normalized to Gapdh) by qRT-PCR in E13.5, E15.5, and E17.5 DRGs. Results shown are fold-changes relative to levels at E13.5 (n ≥ 3 pups per age). J, Validation of Rasa1 knockdown by Rasa1 siRNA in Neuro2A cells after 2 DIV by Western blot analysis. Rasa1 band intensities were normalized to Erk1/2 bands (n = 3). K, Quantitation of GFP+ axon length in Neuro2A cells cotransfected with a GFP-reporter together with the following: miR-132 mimic, control mimic, Rasa1 siRNA, control scrambled siRNA, or Rasa1 plasmid lacking the Rasa1 3′UTR (Rasa1-Δ3′UTR; n > 300 axons per condition). L, Quantitation of GFP+ axon length in Neuro2A cells cotransfected with a GFP-reporter together with miR-132 mimic or control mimic, and either Rasa1-TP or con-TP (n > 100 axons per condition). Bar graphs shown as means ± SEM. *p < 0.05; **p < 0.01; ***p < 0.001; n.s., not significant (t test for B, C, E–J, L; ANOVA with Tukey's HSD post hoc test for K).
Figure 6.
Figure 6.
miR-132 locally regulates Rasa1 mRNA in axons. A, Image of cultured DRG axons and growth cones (inset) immunolabeled for Rasa1 (green) and F-actin (red). Scale bars: 10 μm; inset, 5 μm. B, Verification of miR-132 knockdown by miR-132 PNA inhibitor within 3.5 h in axons from DRG explants plated in a multicompartment microfluidic chamber (see Fig. 2B). Axons extended through microgrooves to the axon compartment, and medium was removed from the total neuron compartment and replaced with sterile H2O for 5 min. Hydrostatic pressure prevented backflow into the axon compartment, and H2O was removed (along with material in the total neuron compartment). PNA inhibitors were applied to the axon compartment for 3.5 h, and total RNA was extracted. miR-132 levels (normalized to Gapdh) were measured by qRT-PCR (n = 6). C, Representative image of DRG explant labeled for NF-M. Axons were severed from cell bodies by a micro-scalpel. Scale bar, 100 μm. D, Images of intact and severed axons from DRG explants treated with control or miR-132 PNA inhibitors for 3.5 h and labeled for Rasa1 and β3-tubulin (Tuj1). In parallel, severed axons were treated with cycloheximide (CHX) for 20 min before treatment with the PNA inhibitors. Line scans represent Rasa1 fluorescence intensity profiles in representative axons. Scale bar, 40 μm. E, Quantitation of Rasa1 AFI in axons (normalized to Tuj1; n > 60 intact axons, and n > 120 severed axons per condition). F, Quantitation of Tuj1 AFI in severed axons treated with control or miR-132 PNA inhibitors (n > 300 axons). G, Axons were isolated as described above in B, and treated with control or miR-132 PNA inhibitors for 3.5 h. Rasa1 mRNA levels (normalized to β-actin) were measured by qRT-PCR (n = 5). Bar graphs shown as means ± SEM. *p < 0.05; **p < 0.01; ***p < 0.001; n.s., not significant (t test for B, F, G; ANOVA with Tukey's HSD post hoc test for E).

References

    1. Ambros V. MicroRNAs and developmental timing. Curr Opin Genet Dev. 2011;21:511–517. doi: 10.1016/j.gde.2011.04.003. - DOI - PMC - PubMed
    1. Anand S, Majeti BK, Acevedo LM, Murphy EA, Mukthavaram R, Scheppke L, Huang M, Shields DJ, Lindquist JN, Lapinski PE, King PD, Weis SM, Cheresh DA. MicroRNA-132-mediated loss of p120RasGAP activates the endothelium to facilitate pathological angiogenesis. Nat Med. 2010;16:909–914. doi: 10.1038/nm.2186. - DOI - PMC - PubMed
    1. Aschrafi A, Schwechter AD, Mameza MG, Natera-Naranjo O, Gioio AE, Kaplan BB. MicroRNA-338 regulates local cytochrome c oxidase IV mRNA levels and oxidative phosphorylation in the axons of sympathetic neurons. J Neurosci. 2008;28:12581–12590. doi: 10.1523/JNEUROSCI.3338-08.2008. - DOI - PMC - PubMed
    1. Baek D, Villén J, Shin C, Camargo FD, Gygi SP, Bartel DP. The impact of microRNAs on protein output. Nature. 2008;455:64–71. doi: 10.1038/nature07242. - DOI - PMC - PubMed
    1. Bartel DP. MicroRNAs: target recognition and regulatory functions. Cell. 2009;136:215–233. doi: 10.1016/j.cell.2009.01.002. - DOI - PMC - PubMed

Publication types

LinkOut - more resources