

ECG diagnosis and classification of acute coronary syndromes
- PMID: 24382164
- PMCID: PMC6931956
- DOI: 10.1111/anec.12130
ECG diagnosis and classification of acute coronary syndromes
Abstract
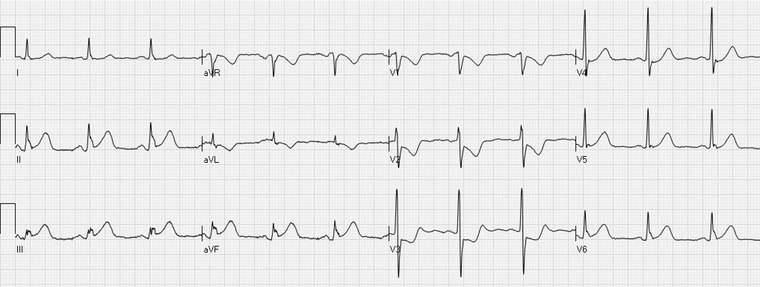
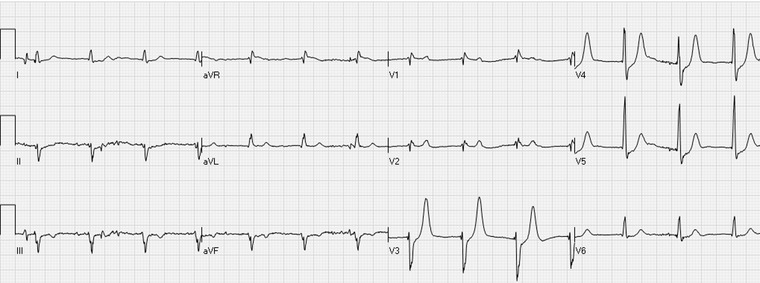
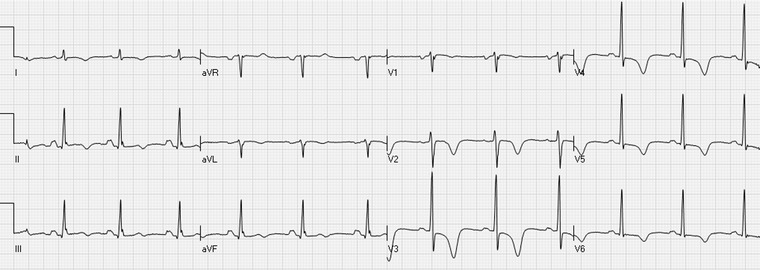
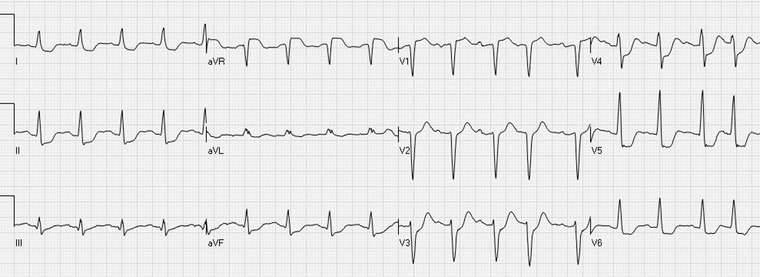
In acute coronary syndromes, the electrocardiogram (ECG) provides important information about the presence, extent, and severity of myocardial ischemia. At times, the changes are typical and clear. In other instances, changes are subtle and might be recognized only when ECG recording is repeated after changes in the severity of symptoms. ECG interpretation is an essential part of the initial evaluation of patients with symptoms suspected to be related to myocardial ischemia, along with focused history and physical examination. Patients with ST-segment elevation on their electrocardiogram and symptoms compatible with acute myocardial ischemia/infarction should be referred for emergent reperfusion therapy. However, it should be emphasized that a large number of patients may have ST-elevation without having acute ST-elevation acute coronary syndrome, while acute ongoing transmural ischemia due to an abrupt occlusion of an epicardial coronary artery may occur in patients with ST-elevation less than the thresholds defined by the guidelines. Up-sloping ST-segment depression with positive T waves is increasingly recognized as a sign of regional subendocardial ischemia associated with severe obstruction of the left anterior descending coronary artery. Widespread ST-segment depression, often associated with inverted T waves and ST-segment elevation in lead aVR during episodes of chest pain, may represent diffuse subendocardial ischemia caused by severe coronary artery disease. In case of hemodynamic compromise, urgent coronary angiography has been increasingly recommended for these patients.
Keywords: ST-segment depression; ST-segment elevation; acute coronary syndrome; electrocardiogram; myocardial infarction; risk stratification; triage.
©2013 Wiley Periodicals, Inc.
Figures
References
-
- Fibrinolytic Therapy Trialists’ (FTT) Collaborative Group . Indications for fibrinolytic therapy in suspected acute myocardial infarction: Collaborative overview of early mortality and major morbidity results from all randomised trials of more than 1000 patients. Lancet 1994;343:311–322. - PubMed
-
- Thygesen K, Alpert JS, Jaffe AS, et al. Third universal definition of myocardial infarction. J Am Coll Cardiol 2012;60:1581–1598. - PubMed
-
- O'Gara PT, Kushner FG, Ascheim DD, et al. 2013 ACCF/AHA guideline for the management of ST‐elevation myocardial infarction: A report of the american college of cardiology Foundation/American heart association task force on practice guidelines. Circulation 2013;127:e362–425. - PubMed
-
- Task Force on the management of ST‐segment elevation acute myocardial infarction of the European Society of Cardiology (ESC) , Steg PG, James SK, et al. ESC guidelines for the management of acute myocardial infarction in patients presenting with ST‐segment elevation. Eur Heart J 2012;33:2569–2619. - PubMed
-
- Huang HD, Birnbaum Y. ST elevation: Differentiation between ST elevation myocardial infarction and nonischemic ST elevation. J Electrocardiol 2011;44:494.e1,494.e12. - PubMed
Publication types
MeSH terms
LinkOut - more resources
Full Text Sources
Other Literature Sources
