. 2014 Feb;124(2):617-30.
doi: 10.1172/JCI72931. Epub 2014 Jan 2.

Cardiotoxicity of doxorubicin is mediated through mitochondrial iron accumulation

Cardiotoxicity of doxorubicin is mediated through mitochondrial iron accumulation

Yoshihiko Ichikawa et al. J Clin Invest. 2014 Feb.

Abstract

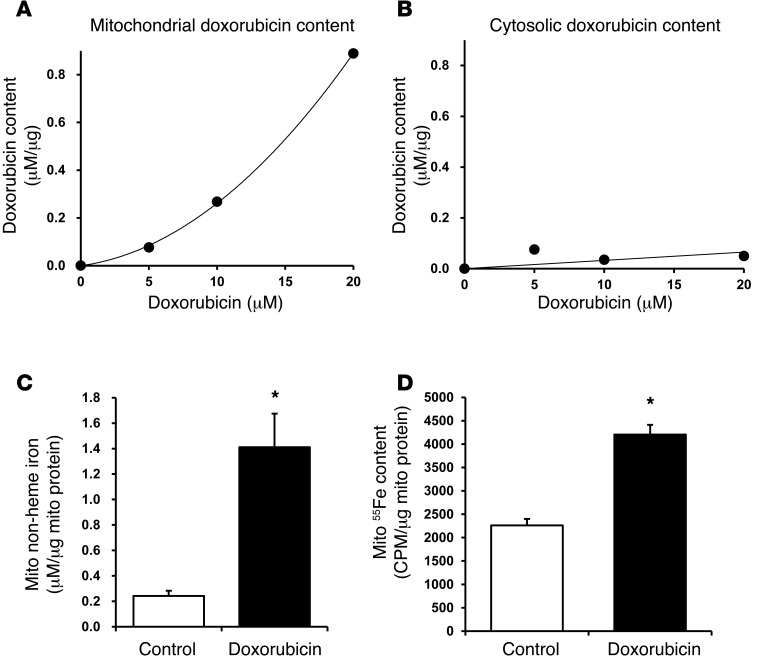
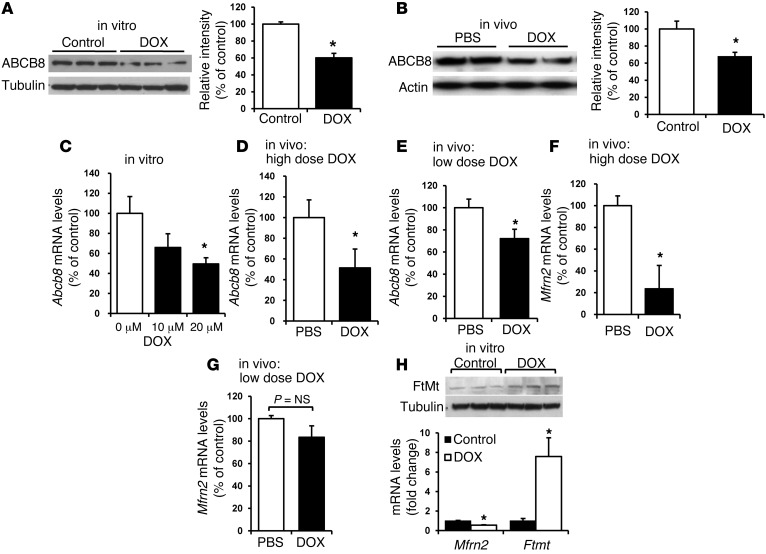
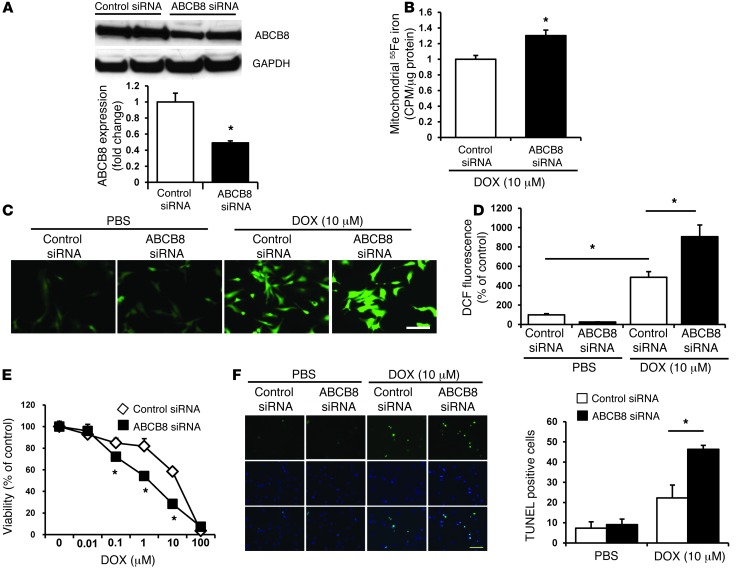
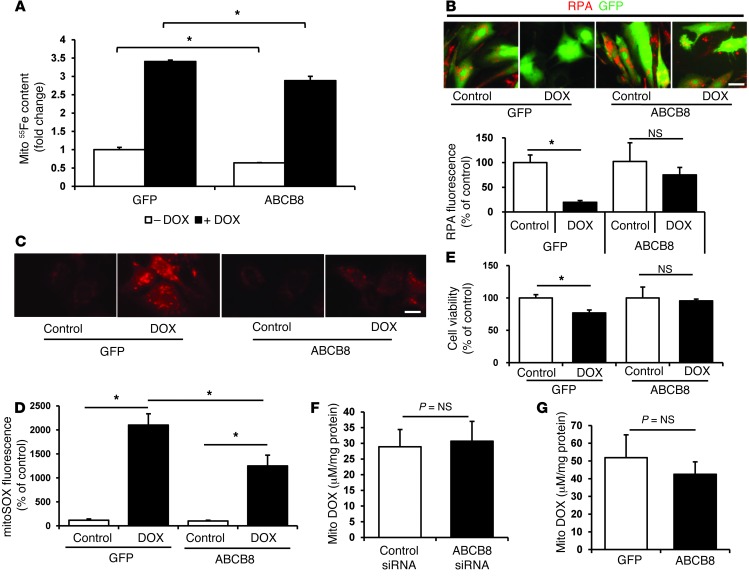
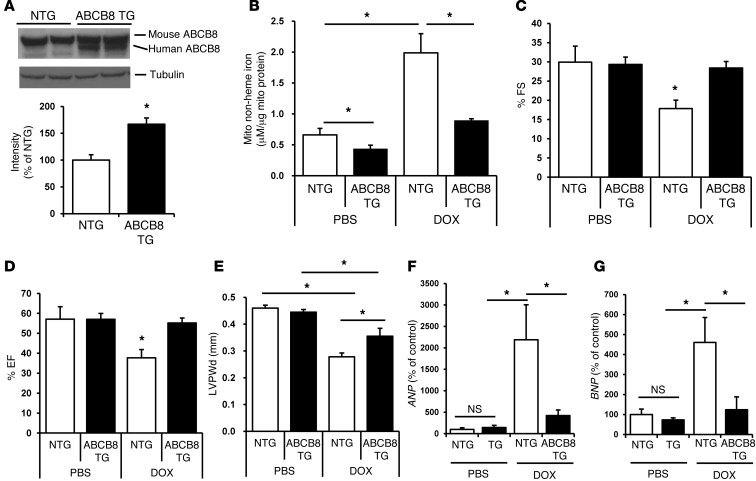
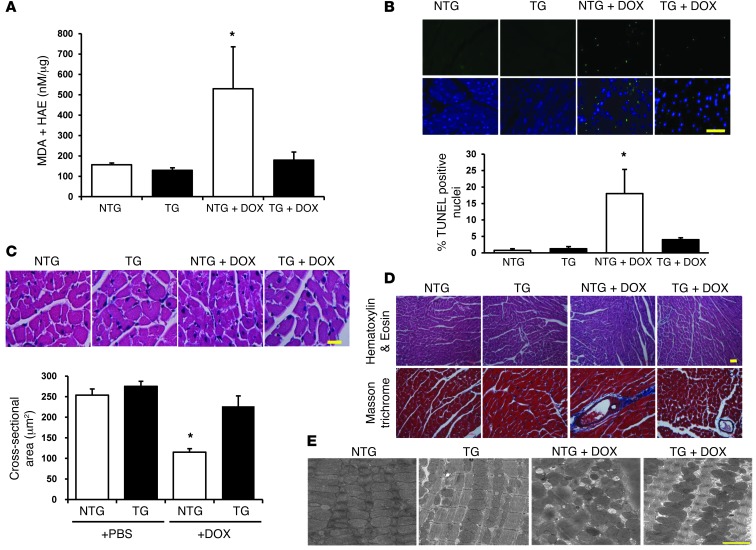
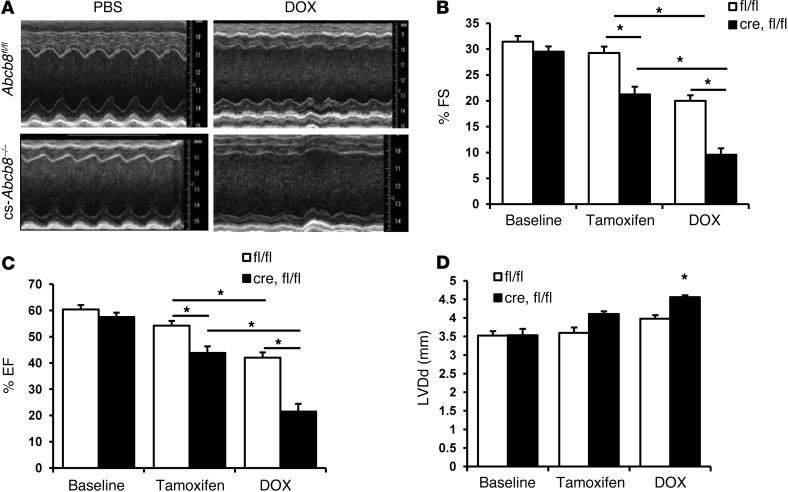
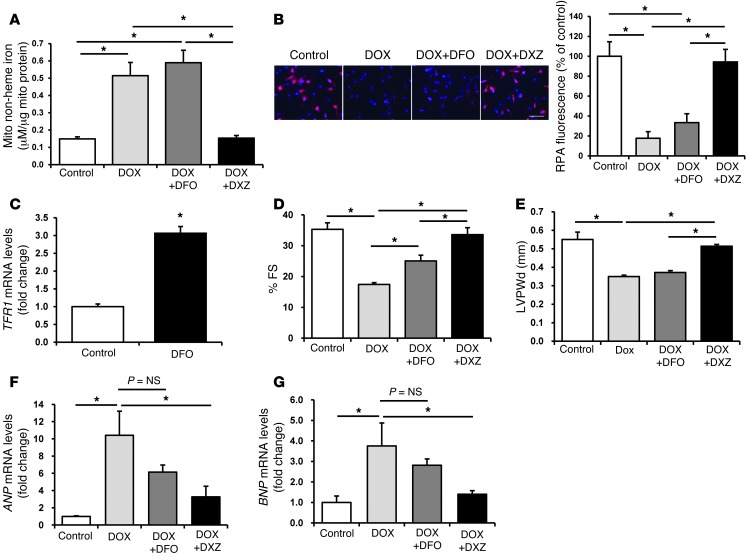
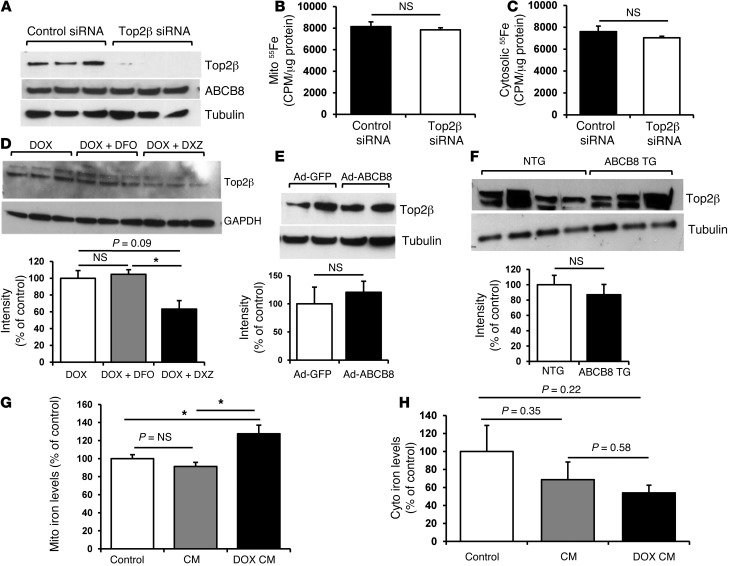
Doxorubicin is an effective anticancer drug with known cardiotoxic side effects. It has been hypothesized that doxorubicin-dependent cardiotoxicity occurs through ROS production and possibly cellular iron accumulation. Here, we found that cardiotoxicity develops through the preferential accumulation of iron inside the mitochondria following doxorubicin treatment. In isolated cardiomyocytes, doxorubicin became concentrated in the mitochondria and increased both mitochondrial iron and cellular ROS levels. Overexpression of ABCB8, a mitochondrial protein that facilitates iron export, in vitro and in the hearts of transgenic mice decreased mitochondrial iron and cellular ROS and protected against doxorubicin-induced cardiomyopathy. Dexrazoxane, a drug that attenuates doxorubicin-induced cardiotoxicity, decreased mitochondrial iron levels and reversed doxorubicin-induced cardiac damage. Finally, hearts from patients with doxorubicin-induced cardiomyopathy had markedly higher mitochondrial iron levels than hearts from patients with other types of cardiomyopathies or normal cardiac function. These results suggest that the cardiotoxic effects of doxorubicin develop from mitochondrial iron accumulation and that reducing mitochondrial iron levels protects against doxorubicin-induced cardiomyopathy.


Figures

Figure 1
Figure 1. DOX regulates mitochondrial iron levels.
DOX levels in the (A) mitochondrial and (B) cytosolic compartments of NRCMs after 16 hours of treatment with 10 μM DOX. (C) Mitochondrial iron levels, as assessed by colorimetric measurement of mitochondrial nonheme iron, in NRCMs that had been treated with DOX (10 μM) or a vehicle control for 16 hours (n = 5). (D) Mitochondrial iron levels, as assessed by measurement of 55Fe, in DOX-treated NRCMs (10 μM for 16 hours, n = 4). Data are presented as mean ± SEM. *P < 0.05.
Figure 2
Figure 2. DOX regulates ABCB8 expression.
(A) Western blot of ABCB8 in NRCMs after treatment with DOX (10 μM for 16 hours) or PBS. The results are summarized in the bar graph (n = 4). (B) Western blot of ABCB8 protein in mice after treatment with 4 intraperitoneal injections of 6 mg/kg/d DOX or PBS every third day. The hearts were harvested 1 month after completion of the protocol. The results are summarized in the bar graph (n = 6). (C) mRNA levels of Abcb8 were measured in NRCMs treated with 0 μM, 10 μM, or 20 μM DOX (n = 4). (DG) mRNA levels of (D and E) Abcb8 (n = 5) and (F and G) Mfrn2 (n = 4) were measured in the hearts of mice that had been treated with a high dose of DOX (10 mg/kg administered 3 times over 5 days) or a low dose of DOX (6 mg/kg every third day for 4 injections) or saline (PBS). (H) Western blot analysis of mitochondrial ferritin (FtMt) and Mfrn2 and Ftmt mRNA levels in NRCMs treated with 10 μM DOX or control vehicle. Data are presented as mean ± SEM. *P < 0.05.
Figure 3
Figure 3. ABCB8 downregulation exacerbates the cardiotoxic effects of DOX in vitro.
(A) Western blot of NRCMs treated with control and ABCB8 siRNA and probed with ABCB8 antibody, indicating effective reduction in ABCB8 protein levels with siRNA treatment (n = 4). (B) Mitochondrial iron levels, as assessed by measurement of 55Fe, in cells transfected with control or ABCB8 siRNA and then treated with 10 μM DOX for 16 hours (n = 4). (C) Cellular ROS levels, as assessed by DCF, in NRCMs after treatment with 10 μM DOX for 16 hours. Scale bar: 100 μm. (D) Bar graph summary of the DCF studies (n = 5). (E) Cell viability, as assessed by MTS, in NRCMs transfected with control or ABCB8 siRNA and treated with increasing concentrations of DOX (n = 6). (F) DOX-induced cell death, as assessed by TUNEL staining, in cells transfected with control or ABCB8 siRNA. Quantification of the TUNEL staining is presented (n = 3). Scale bar: 100 μm. Data are presented as mean ± SEM. *P < 0.05 vs. control.
Figure 4
Figure 4. ABCB8 overexpression reduces DOX-induced mitochondrial iron accumulation and cardiotoxicity in vitro.
(A) Mitochondrial iron levels, as assessed by 55Fe in NRCMs transfected with adenoviruses coding for GFP or ABCB8 expression and treated with 10 μM DOX for 16 hours or vehicle control (n = 4). (B) RPA fluorescence in NRCMs transfected with the GFP or ABCB8 adenovirus and treated with 10 μM DOX for 16 hours. Lower levels of RPA fluorescence correspond to an increase in mitochondrial iron (n = 6). Scale bar: 100 μm. (C) ROS levels, as assessed by MitoSOX, in NRCMs transfected with the GFP or ABCB8 adenovirus and treated with DOX (10 μM for 16 hours) (n = 5). Scale bar: 100 μm. (D) Quantification of the ROS levels measured in C. (E) Cell viability, as assessed by MTS assay, in NRCMs transfected with the GFP or ABCB8 adenovirus and treated with 10 μM DOX for 16 hours (n = 6). (F) Mitochondrial DOX levels in NRCMs treated with control and ABCB8 siRNA, followed by treatment with 10 μM DOX for 16 hours (n = 4). (G) Mitochondrial DOX levels in NRCMs transfected with the GFP or ABCB8 adenovirus, followed by treatment with 10 μM DOX for 16 hours (n = 4). Data are presented as mean ± SEM. *P < 0.05.
Figure 5
Figure 5. TG mice that overexpress ABCB8 in the heart are resistant to DOX cardiotoxicity.
(A) Western blots demonstrating the overexpression of ABCB8 in the hearts of TG mice. Human ABCB8 migrates slightly lower than the mouse isoform. The results are summarized in the bar graph (n = 4). (B) Mitochondrial iron levels in NTG and ABCB8 TG mice at baseline (n = 4) and after treatment with DOX (n = 5) according to protocol 2. (CE) Measurements of (C) FS, (D) EF, and (E) LVPWd in NTG and ABCB8 TG mice after DOX treatment according to protocol 2. ABCB8 TG mice maintained their cardiac systolic function after DOX treatment (n = 4–6 mice in each group). (F and G) Markers of heart failure, (F) ANP and (G) BNP, in NTG and ABCB8 TG mice (n = 5). Data are presented as mean ± SEM. *P < 0.05.
Figure 6
Figure 6. Hearts from ABCB8 TG mice display reductions in ROS and structural damage in response to DOX.
(A) Lipid peroxidation products (i.e., markers of cellular ROS levels) in ABCB8 TG and NTG hearts in the presence and absence of DOX treatment, as assessed by measurement of MDA and HAE (n = 6). (B) TUNEL-positive cells in NTG and ABCB8 TG hearts in the presence and absence of DOX treatment (n = 3). Scale bar: 200 μm. (C) H&E staining for assessment of cardiomyocyte size in NTG and TG hearts at baseline and after treatment with DOX. A summary of cardiomyocyte size in the H&E-stained sections (n = 4) is shown. Scale bar: 200 μm. (D) Assessment of fibrosis by Masson trichrome staining of ABCB8 TG and NTG hearts after DOX treatment. Scale bar: 100 μm. (E) Representative electron microscopy images of hearts from NTG and ABCB8 TG mice after treatment with PBS or DOX. Hearts from the ABCB8 TG mouse treated with DOX show well-aligned mitochondria, with clearly distinguishable cristae. Scale bar: 1 μm. Data are presented as mean ± SEM. *P < 0.05.
Figure 7
Figure 7. Treatment of mice with ABCB8 deletion in the heart leads to exacerbated cardiomyopathy.
(A) Echocardiography images of control (Abcb8fl/fl) and Abcb8fl/fl mice crossed with α-MHC-MCM mice (i.e., cs-Abcb8–/– mice) after treatment with PBS or DOX and treatment with tamoxifen. (B) FS, (C) EF, and (D) LVDd in Abcb8fl/fl mice or Abcb8fl/fl mice (fl/fl) crossed with α-MHC-MCM animals (cre,fl/fl) at baseline after treatment with tamoxifen and after treatment with tamoxifen and DOX (n = 4–5). Data are presented as mean ± SEM. *P < 0.05.
Figure 8
Figure 8. DXZ reduces mitochondrial iron and reverses the cardiotoxic effects of DOX.
(A) Mitochondrial nonheme iron levels in NRCMs, as assessed by BPS after treatment with or without DXZ (100 μM) or DFO (200 μM) in the presence of 10 μM DOX for 16 hours (n = 4). (B) Levels of mitochondrial iron in NRCMs, as assessed by RPA staining after treatment with or without DXZ (100 μM) or DFO (200 μM) in the presence of 10 μM DOX for 16 hours (n = 4). Scale bar: 100 μm. A summary of the RPA data is shown. (C) Levels of TFR1 mRNA in NRCMs at baseline (control) and after treatment with DFO (200 μM, n = 6). (D) FS and (E) LVPWd in control and DOX-treated mice that had been cotreated with or without DXZ or DFO (n = 6). (F and G) Levels of (F) ANP and (G) BNP in the hearts of mice treated with DOX, DOX, and DFO or DOX and DXZ (n = 4). Data are presented as mean ± SEM. *P < 0.05.
Figure 9
Figure 9. Cytotoxicity of DOX through mitochondrial iron is independent of the Top-2β pathway.
(A) Western blot analysis of Top-2β and ABCB8 expression in NRCMs treated with Top-2β or control siRNA, showing efficient reduction in Top-2β protein with siRNA treatment but no change in ABCB8 protein level. (B) Mitochondrial and (C) cytosolic iron levels determined by quantification of 55Fe radioactivity in NRCMs with Top-2β or control siRNA (n = 4). (DF) Western blot analysis of Top-2β protein (D) in NRCMs treated with 10 μM DOX with or without 200 μM DXZ or 200 μM DFO for 16 hours, (E) in NRCMs with adenoviral overexpression of ABCB8, or (F) in ABCB8 TG and NTG mice treated with DOX. (G) Mitochondrial iron and (H) cytosolic iron levels in heart samples from patients without cardiomyopathy (control), patients with cardiomyopathy from non–DOX-related causes (CM), or patients with DOX-induced cardiomyopathy (DOX CM) (n = 5). Data are presented as mean ± SEM. *P < 0.05.

References

    1. Binaschi M, et al. Anthracyclines: selected new developments. Current medicinal chemistry. Curr Med Chem Anticancer Agents. 2001;1(2):113–130. - PubMed
    1. Ferrans VJ, Clark JR, Zhang J, Yu ZX, Herman EH. Pathogenesis and prevention of doxorubicin cardiomyopathy. Tsitologiia. 1997;39(10):928–937. - PubMed
    1. Jones RL, Swanton C, Ewer MS. Anthracycline cardiotoxicity. Expert Opin Drug Saf. 2006;5(6):791–809. - PubMed
    1. Simunek T, Sterba M, Popelova O, Adamcova M, Hrdina R, Gersl V. Anthracycline-induced cardiotoxicity: overview of studies examining the roles of oxidative stress and free cellular iron. Pharmacol Rep. 2009;61(1):154–171. - PubMed
    1. Berthiaume JM, Wallace KB. Adriamycin-induced oxidative mitochondrial cardiotoxicity. Cell Biol Toxicol. 2007;23(1):15–25. - PubMed

Publication types

MeSH terms