. 2014 Dec;72(6):1599-609.
doi: 10.1002/mrm.25071. Epub 2013 Dec 31.

Simultaneous multiagent hyperpolarized (13)C perfusion imaging

Affiliations

Simultaneous multiagent hyperpolarized (13)C perfusion imaging

Cornelius von Morze et al. Magn Reson Med. 2014 Dec.

Abstract

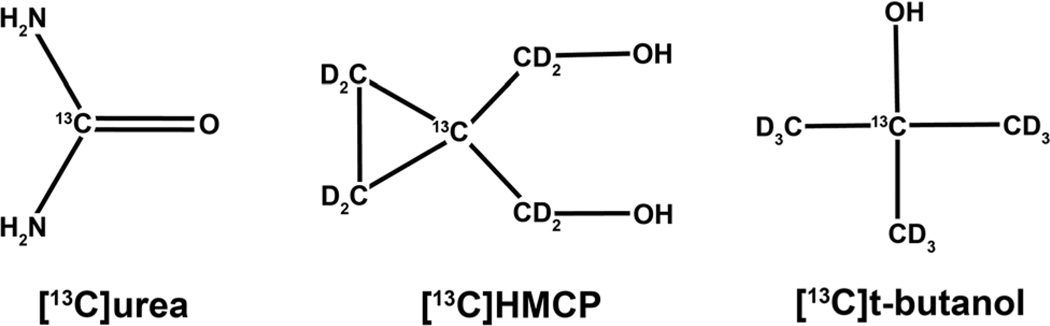
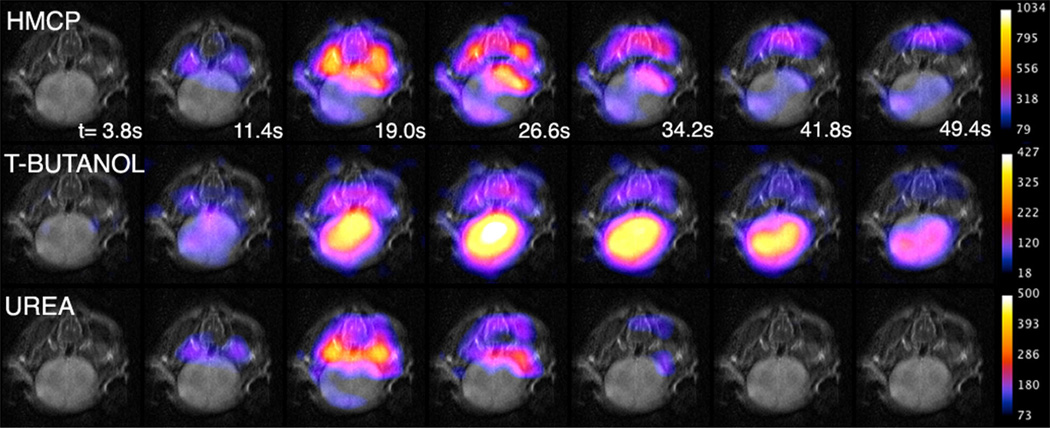
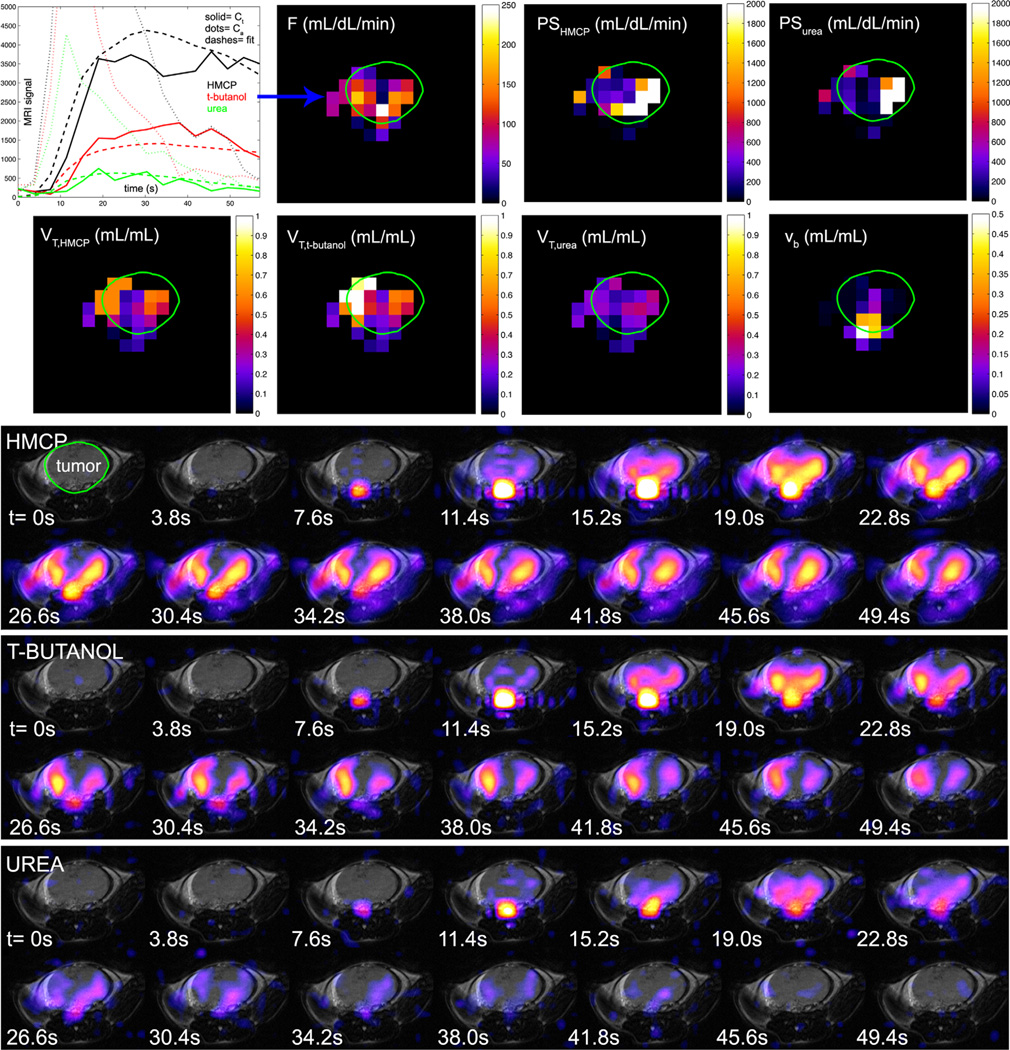
Purpose: To demonstrate simultaneous hyperpolarization and imaging of three (13)C-labeled perfusion MRI contrast agents with dissimilar molecular structures ([(13)C]urea, [(13)C]hydroxymethyl cyclopropane, and [(13)C]t-butanol) and correspondingly variable chemical shifts and physiological characteristics, and to exploit their varying diffusibility for simultaneous measurement of vascular permeability and perfusion in initial preclinical studies.

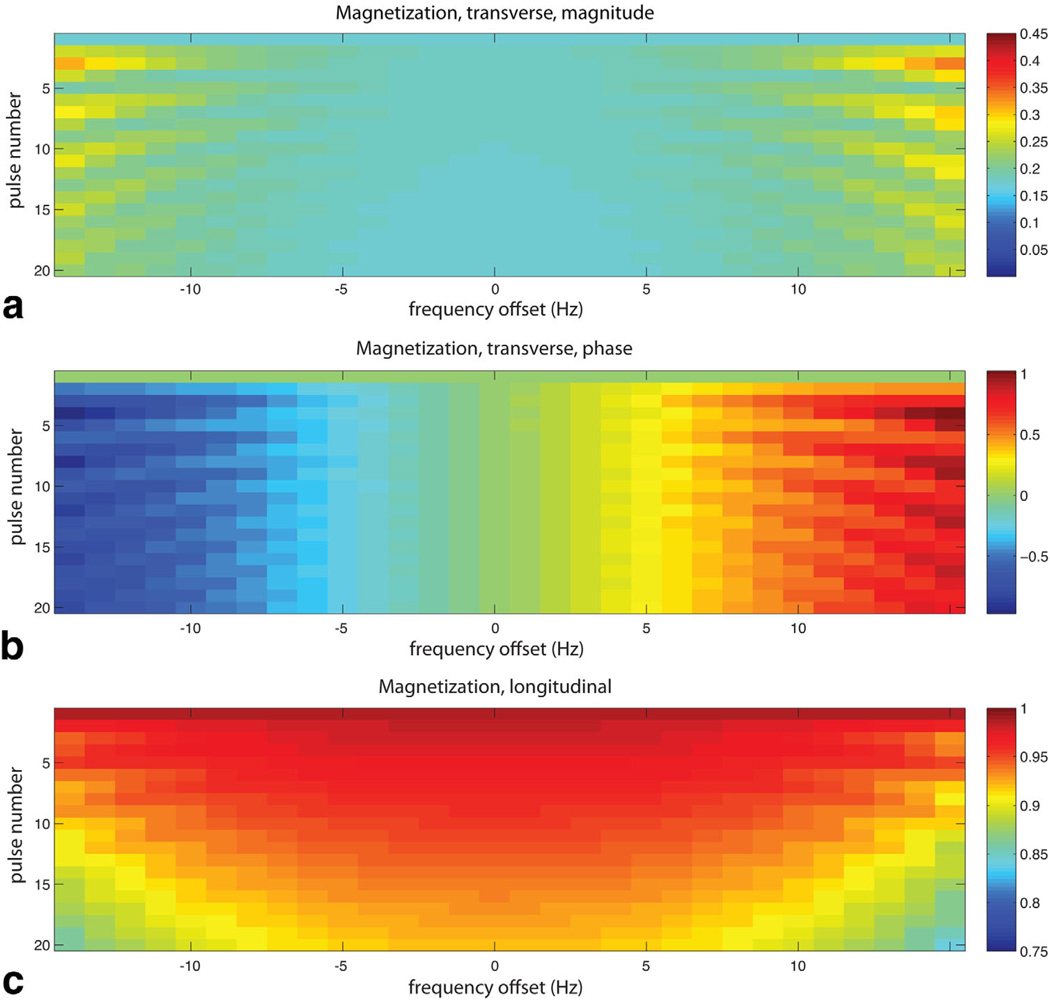
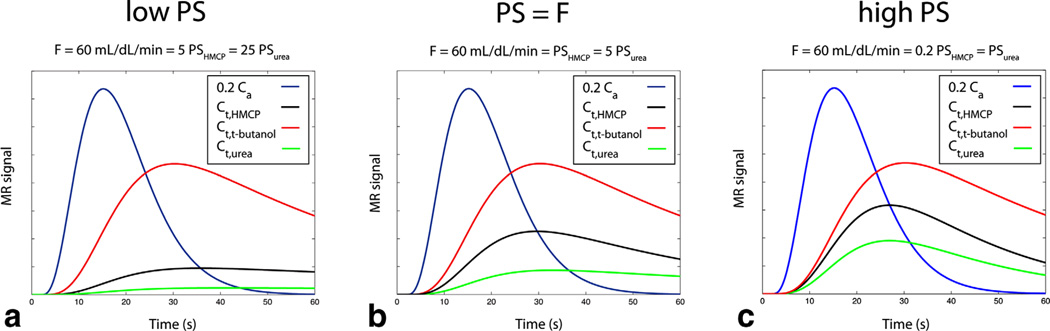
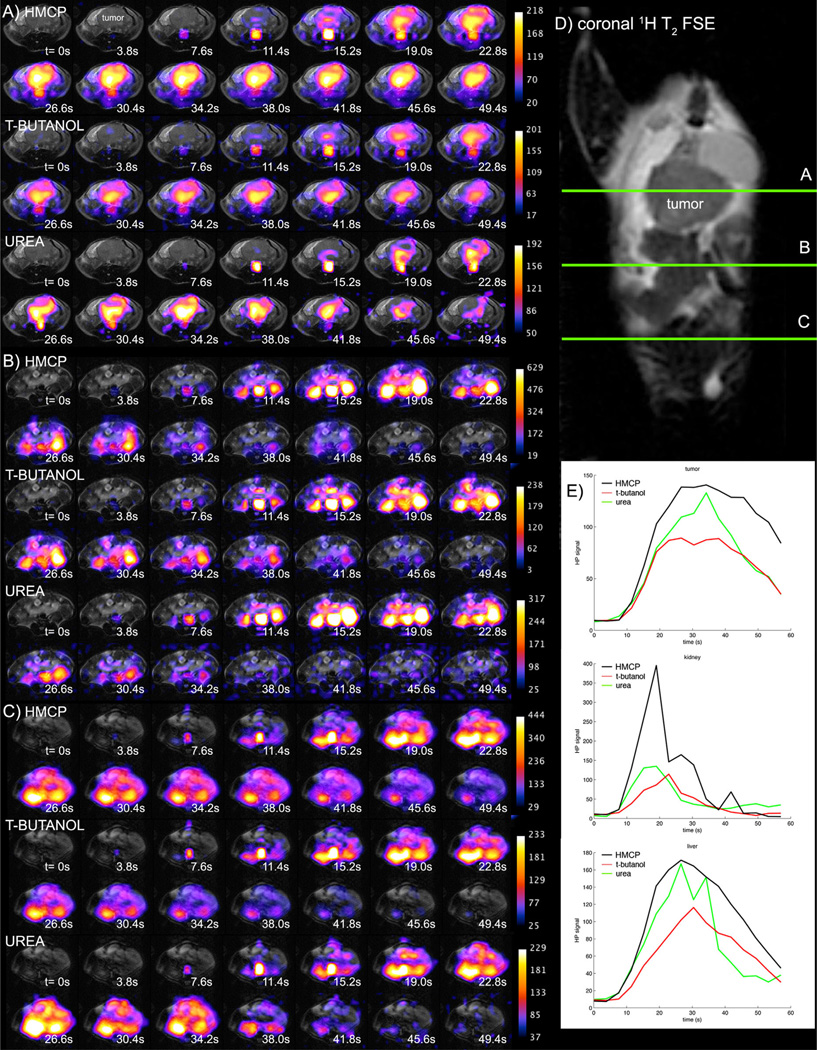
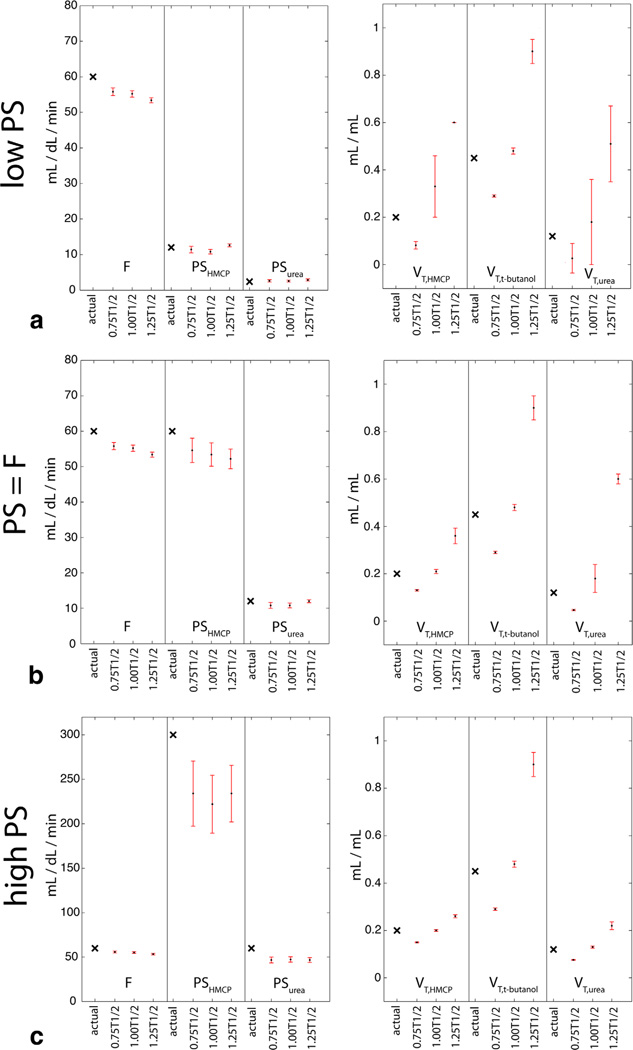
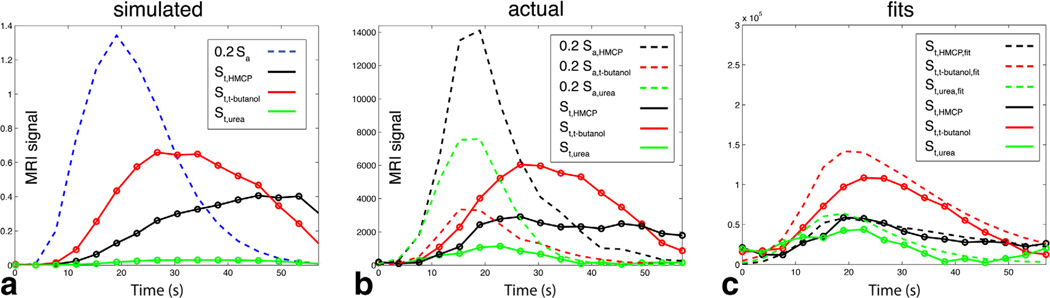
Methods: Rapid and efficient dynamic multislice imaging was enabled by a novel pulse sequence incorporating balanced steady state free precession excitation and spectral-spatial readout by multiband frequency encoding, designed for the wide, regular spectral separation of these compounds. We exploited the varying bilayer permeability of these tracers to quantify vascular permeability and perfusion parameters simultaneously, using perfusion modeling methods that were investigated in simulations. "Tripolarized" perfusion MRI methods were applied to initial preclinical studies with differential conditions of vascular permeability, in normal mouse tissues and advanced transgenic mouse prostate tumors.

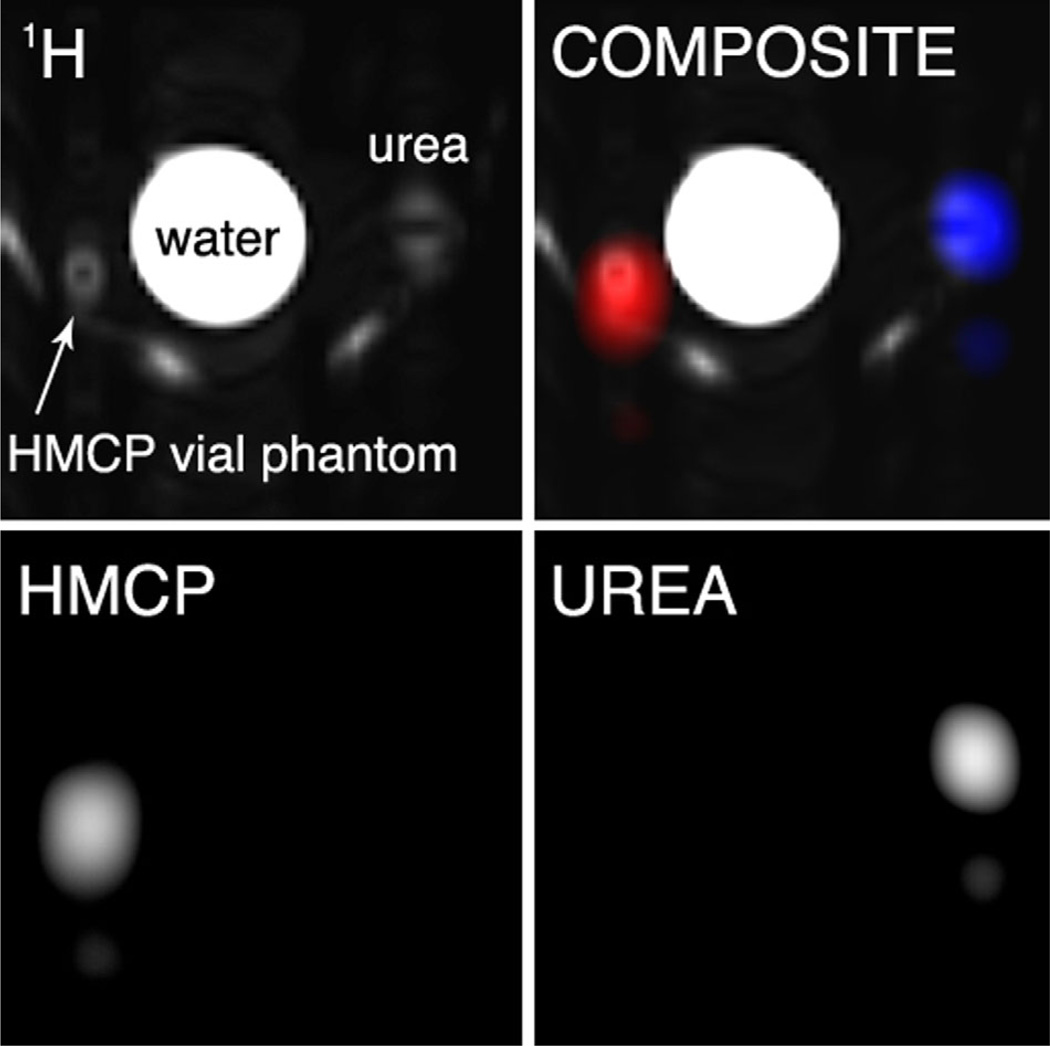
Results: Dynamic imaging revealed clear differences among the individual tracer distributions. Computed permeability maps demonstrated differential permeability of brain tissue among the tracers, and tumor perfusion and permeability were both elevated over values expected for normal tissues.

Conclusion: Tripolarized perfusion MRI provides new molecular imaging measures for specifically monitoring permeability, perfusion, and transport simultaneously in vivo.

Keywords: 13C; DNP; hyperpolarized; perfusion imaging; permeability; prostate cancer.


Figures

FIG. 1
FIG. 1
Molecular structures of HP 13C perfusion tracers enabled by dissolution DNP.
FIG. 2
FIG. 2
Simulated transient response of HP magnetization to SSFP RF pulse train (α = ±20°) over a 1-ppm range of Larmor frequencies near resonance, in terms of magnetization magnitude (a), phase (b), and remaining z-component (c) as a function of pulse number.
FIG. 3
FIG. 3
Simulated ideal tripolarized arterial (Ca) and tissue (Ct) concentration curves for three scenarios described in text (a–c), prior to inclusion of relaxation effects, noise, and randomization of tracer arrival time.
FIG. 4
FIG. 4
Thermal vial phantom images of enriched 13C urea (6 M) and HMCP (5 M), obtained using balanced SSFP excitation with multiband frequency encoding readout. Images include: 1H image (top left), individual 13C images (bottom row), and composite overlay (gray = 1H, blue = urea, red = HMCP). Unlabeled bright areas in 1H image are from a water-heating pad attached to the coil.
FIG. 5
FIG. 5
Axial tripolarized images of mouse brain (color) overlaid on T2 images (gray). Images are remarkable for showing that t-butanol rapidly crosses the blood–brain barrier, unlike urea and HMCP.
FIG. 6
FIG. 6
Tripolarized 13C dynamic perfusion images (color) from three adjacent axial slices (a–c) in TRAMP mouse, overlaid on T2-weighted fast spin echo 1H images (gray). For optimal contrast, different window-level settings were applied to each image series as indicated by the colorbars on the right. Slice locations are indicated on coronal 1H image (d). Mean tissue-specific perfusion curves (e) are given for HMCP (black), t-butanol (red), and urea (green), in tumor (top), kidney (middle), and liver (bottom).
FIG. 7
FIG. 7
Simulated impact of potential relaxation effects on quantitation of perfusion and permeability parameters in three biological regimes as described in text (a–c, as shown in Fig. 3). Actual parameter values are marked by a black × in the left-most column of each data set. Shown are the estimated parameter means (black dot)±SDs (upper and lower bounds shown by red error bars) over 500 repetitions with errors in estimated T1 and T2 relaxation times of ±25%.
FIG. 8
FIG. 8
Comparison of simulation data (a) with actual raw uncorrected in vivo mouse brain dynamic data (b) including relaxation effects and noise, under low PS conditions. c: Fits of corrected mouse brain tissue data to the model. The selected voxel was from the center of the mouse brain, with estimated F = 220 mL/dL/min, PSurea/HMCP <20 mL/dL/min. The ratio of tissue to arterial signal levels was higher for the in vivo data compared with simulation data due to higher perfusion (F = 220 mL/dL/min versus 60 mL/dL/min for simulations). The single simulated Sa curve depicted in panel A ignores relaxation and therefore reflects the assumed identical arterial concentration for all tracers. The actual individual simulated arterial signal curves differed slightly due to added relaxation and noise.
FIG. 9
FIG. 9
Quantification of perfusion and permeability parameters in axial slice through TRAMP tumor based on tripolarized perfusion data. Tumor borders are indicated in green. Dynamic signal curves for the voxel indicated by the blue arrow, estimated blood flow map, tracer permeability surface products, tracer distribution volumes, and blood volume. The mean tumor blood flow was 73 mL/dL/min. Corresponding raw dynamic tripolarized image data (color), overlaid on anatomic T2-weighted 1H MRI image for this slice (gray), are shown below.

References

    1. Ardenkjaer-Larsen JH, Fridlund B, Gram A, Hansson G, Hansson L, Lerche MH, Servin R, Thaning M, Golman K. Increase in signal-to-noise ratio of > 10,000 times in liquid-state NMR. Proc Natl Acad Sci U S A. 2003;100:10158–10163. - PMC - PubMed
    1. Golman K, Ardenkjaer-Larsen JH, Petersson JS, Mansson S, Leunbach I. Molecular imaging with endogenous substances. Proc Natl Acad Sci U S A. 2003;100:10435–10439. - PMC - PubMed
    1. von Morze C, Larson PE, Hu S, Keshari K, Wilson DM, Ardenkjaer-Larsen JH, Goga A, Bok R, Kurhanewicz J, Vigneron DB. Imaging of blood flow using hyperpolarized [13C]urea in preclinical cancer models. J Magn Reson Imaging. 2011;33:692–697. - PMC - PubMed
    1. Johansson E, Månsson S, Wirestam R, Svensson J, Petersson JS, Golman K, Ståhlberg F. Cerebral perfusion assessment by bolus tracking using hyperpolarized 13C. Magn Reson Med. 2004;51:464–472. - PubMed
    1. Svensson J, Månsson S, Johansson E, Petersson JS, Olsson LE. Hyperpolarized 13C MR angiography using trueFISP. Magn Reson Med. 2003;50:256–262. - PubMed

Publication types

MeSH terms