Review
. 2014 Mar 17;15(4):587-99.
doi: 10.1002/cphc.201300880. Epub 2013 Dec 30.

The role of molecular dipole orientation in single-molecule fluorescence microscopy and implications for super-resolution imaging

Affiliations
Review

The role of molecular dipole orientation in single-molecule fluorescence microscopy and implications for super-resolution imaging

Mikael P Backlund et al. Chemphyschem. .

Abstract

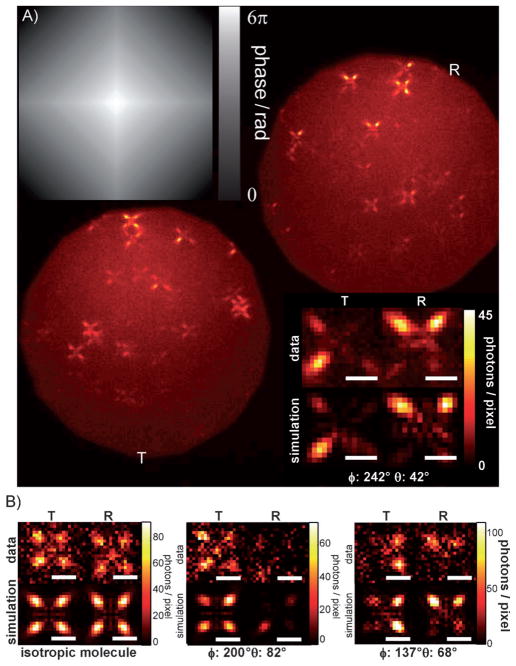
Numerous methods for determining the orientation of single-molecule transition dipole moments from microscopic images of the molecular fluorescence have been developed in recent years. At the same time, techniques that rely on nanometer-level accuracy in the determination of molecular position, such as single-molecule super-resolution imaging, have proven immensely successful in their ability to access unprecedented levels of detail and resolution previously hidden by the optical diffraction limit. However, the level of accuracy in the determination of position is threatened by insufficient treatment of molecular orientation. Here we review a number of methods for measuring molecular orientation using fluorescence microscopy, focusing on approaches that are most compatible with position estimation and single-molecule super-resolution imaging. We highlight recent methods based on quadrated pupil imaging and on double-helix point spread function microscopy and apply them to the study of fluorophore mobility on immunolabeled microtubules.

Keywords: fluorescence microscopy; molecular orientation; rotational mobility; single-molecule studies; super-resolution imaging.


Figures

Figure 1
Figure 1
Coordinate definitions and dipole emission distribution. A) A molecular dipole is represented by a double-barbed orange arrow. θ is the polar angle made with the optical (z) axis. ϕ is the azimuthal angle about the z axis. B) Contours of constant fluorescence intensity emitted by a dipole, as projected in two dimensions. The emitted intensity in a given direction is proportional to sin2β, where β is the angle between the transition dipole moment μ⃑ and the Poynting vector S⃑ of the emitted wave at a particular point in space. The pattern is rotationally symmetric about the dipole, forming a toroidal shape in three dimensions.
Figure 2
Figure 2
Three categories of methods for determining molecular orientation with far-field fluorescence microscopy. A) Polarized illumination and/or detection. The illustration depicts an example setup similar to those in refs. [9, 11] based on modulation of the illumination polarization using an electro-optic modulator (EOM). The basic epi-fluorescence setup consists of a Köhler lens (K. L.) which focuses the polarized illumination light onto the back aperture of the objective (Obj.) to produce a wide-field spot in the sample. Fluorescence is collected back through the objective and focused by a tube lens (T. L.) onto a charge-coupled device (CCD) camera. The dashed box before the T. L. represents where a polarizer might be placed if polarized detection were implemented. B) Methods which make use of the distinct spatial patterns of the polarized fields at the focus of the illumination light. The illustration depicts an example based on ref. [17]. X-polarized illumination light traverses an opaque annular mask which removes the low-angle rays before being focused to a diffraction-limited confocal spot by the objective. The resulting intensity patterns corresponding to the squares of each of the polarized incident fields are shown in the inset. Each of the three boxes in the inset is a square of length 1 μm. The number in the lower right of each box indicates the factor by which the intensity is scaled relative to that in the left box. Without the modulated illumination this number would be much larger for the middle and right boxes. The confocal spot is raster scanned over the sample and the collected fluorescence is focused through a confocal pinhole onto a point detector such as an avalanche photodiode (APD). C) Methods which rely on the spatial variation of emitted fluorescence. The illustration depicts an example similar to that in ref. [47] based on defocused imaging. The epi-illumination (or TIRF) configuration is again employed with a slight defocusing of the optics which causes the images of molecules to depend highly on orientation. Simulated images of six example molecules at various orientations are shown in the inset (scale bar: 1 μm). Related methods make use of the information available at the back focal plane (BFP) of the microscope, which is marked with a dashed line.
Figure 3
Figure 3
Effects of rotational mobility on simulated SMACM reconstructions. A) Simulated super-resolution reconstructions of two crossing dual-antibody-labeled microtubules modeled as hollow cylinders of diameter 40 nm whose center axes are separated in z by 200 nm. The top panel shows results for a wobble cone angle of α=15° while the bottom shows the α=60° case. Color-scale units are SM localizations per 0.5 nm2. B) Histograms of the binned localizations within the boxes shown in (A). The top two panels are these distributions in the white and yellow boxes of the α=15° case, along with the fit to the sum of two Gaussians (cyan). The bottom two panels show the corresponding histograms for the α=60° case, along with the fit (magenta). C) Simulated super-resolution reconstructions of a section of a cell membrane modeled as a hemispherical cap of radius 1.5 μm for the α=15° and α=60° cases. Color-scale units are SM localizations per 0.5 nm2. D) Diagram showing an xz slice of the simulated membrane in (C). Because the dipoles (orange) are embedded with orientation orthogonal to the membrane they experience apparent lateral shifts (purple) in the direction of the cell edge with magnitude proportional to distance from the focal plane. Scale bars: 200 nm. Reprinted from ref. [42] with permission from the American Chemical Society.
Figure 4
Figure 4
Illustration of the back focal plane. A) Schematic showing the 4f optical system which is added to a standard microscope in order to facilitate access to the BFP. The intermediate image plane is where the camera would normally be placed in a standard microscope configuration. Methods which utilize Fourier plane processing place an SLM or a phase/amplitude mask at the position of the plane conjugate to the BFP. B) Examples of BFP intensity patterns for molecules at various θ.
Figure 5
Figure 5
Quadrated pupil imaging. A) Phase mask implemented for quadrated pupil imaging (top left). Image of a field of DCDHF-N-6 molecules embedded in PMMA as seen in both the R (top right) and T (bottom left) polarization channels. Molecular orientations are fixed in this sample, causing molecules to appear as a pair of four-pointed stars with lobes of unequal intensity. Experimental images of an example molecule and the images of the corresponding best-fit orientation are shown (bottom right). The best-fit orientation is printed at the bottom of this panel. B) Images of three example Alexa 647 molecules from the immunolabeled microtubule sample. The sample contains both freely rotating dipoles as indicated by lobes of equal intensity (left) and molecules with more constrained orientation as indicated by lobes of unequal intensity (middle and right). All scale bars: 1 μm. A portion of this Figure is reprinted from ref. [45] with permission from the Optical Society of America.
Figure 6
Figure 6
Determination of molecular orientation and position with the DH-PSF. A) Path of the DH-PSF lobes as a function of z carves out the shape of a double helix. The center pale blue plane marks xy image when the molecule is in focus and the lobes are horizontal. Planes are spaced apart by 1 μm axially. B) DH-PSF phase mask. C) Histograms of estimations of molecular orientation of one example molecule as measured at many z positions. A Gaussian fit is overlaid in magenta and the purple arrows mark the independently estimated orientation from defocused imaging. D) Four images of the same example molecule at a single z position. The four images were obtained in the transmitted channel with the mask rotated 90° (red), the transmitted channel with the mask upright (gold), the reflected channel with the mask rotated (green), and the reflected channel with the mask upright (blue). Scale bar: 1 μm. E) 2D histograms of lateral localizations of same example molecule as measured at many z positions. The top panel shows the uncorrected case and the bottom panel shows the corrected case (using the average estimated orientation). Bin size: 15 nm; displayed axes length: 100 nm. Reprinted from ref. [46] with permission from the U.S. National Academy of Sciences.
Figure 7
Figure 7
Position and orientation-dependent parameters of Alexa Fluor 647-immunolabeled microtubules in a BSC-1 cell measured with the DH microscope. A) Two-dimensional histogram of the median z position of Alexa 647 localizations recorded within each pixel. These localizations span a depth range of ~1.3 μm. Comparison to a diffraction-limited 2D image taken at low pumping intensity (upper-right) shows the inherent 3D resolution improvement achievable with the DH microscope. Bin size =30 nm, scale bar =5 μm. B) Distributions of lobe asymmetry (LA) measured over all molecules detected in the reflected channel (left) and transmitted channel (middle), as well as the distribution of linear dichroism (LD, right), over the entire region plotted in (A). C) Spatial dependence of LA for molecules detected in the reflected channel (left) and transmitted channel (middle), as well as the spatial dependence of LD (right), plotted over the sub-region outlined by the white rectangle in (A). Bin size =30 nm, scale bar =1 μm.

References

    1. Moerner WE, Fromm DP. Rev Sci Instrum. 2003;74:3597–3619.
    1. Moerner WE, Orrit M. Science. 1999;283:1670–1676. - PubMed
    1. Moerner WE. Proc Natl Acad Sci USA. 2007;104:12596–12602. - PMC - PubMed
    1. Moerner WE. In: Single-Molecule Optical Spectroscopy and Imaging: From Early Steps to Recent Advances in Single Molecule Spectroscopy in Chemistry, Physics and Biology: Nobel Symposium 138 Proceedings. Graslund A, Rigler R, Widengren J, editors. Springer; Berlin: 2009. pp. 25–60.
    1. Betzig E, Chichester RJ. Science. 1993;262:1422–1425. - PubMed

Publication types

MeSH terms