. 2014 Jan 2:14:1.
doi: 10.1186/1471-2407-14-1.

Prolyl-4-hydroxylase α subunit 2 promotes breast cancer progression and metastasis by regulating collagen deposition

Affiliations

Prolyl-4-hydroxylase α subunit 2 promotes breast cancer progression and metastasis by regulating collagen deposition

Gaofeng Xiong et al. BMC Cancer. .

Abstract

Background: Increased collagen deposition provides physical and biochemical signals to support tumor growth and invasion during breast cancer development. Therefore, inhibition of collagen synthesis and deposition has been considered a strategy to suppress breast cancer progression. Collagen prolyl-4-hydroxylase α subunit 2 (P4HA2), an enzyme hydroxylating proline residues in -X-Pro-Gly- sequences, is a potential therapeutic target for the disorders associated with increased collagen deposition. However, expression and function of P4HA2 in breast cancer progression are not well investigated.

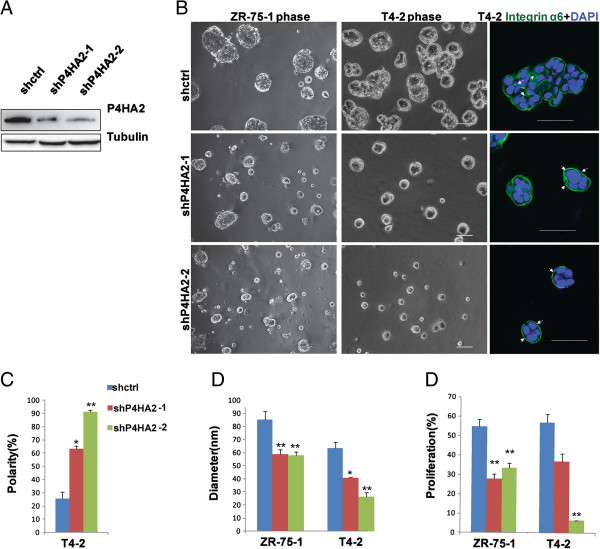
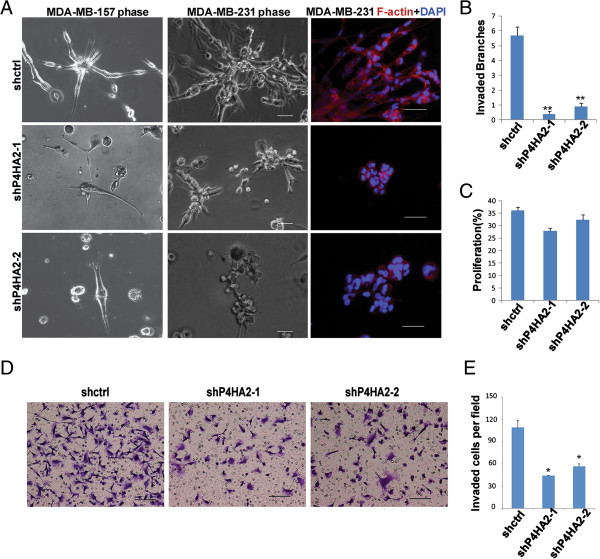
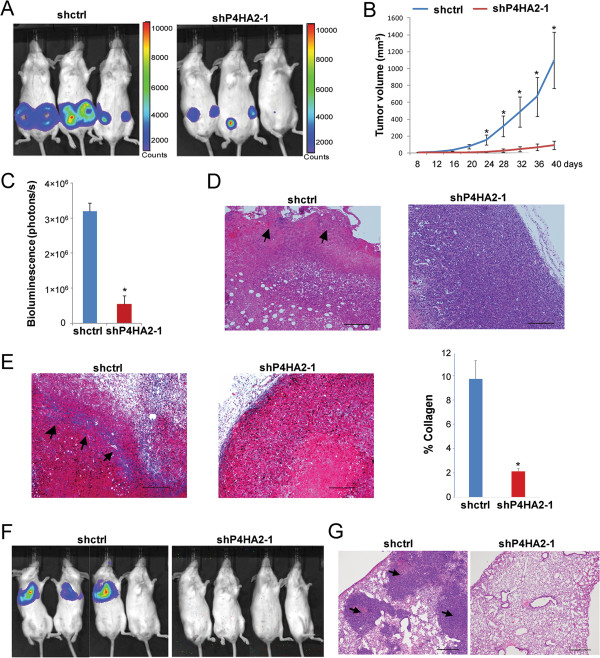
Methods: Gene co-expression analysis was performed in the published microarray datasets to identify potential regulators of collagen I, III, and IV in human breast cancer tissue. Expression of P4HA2 was silenced by shRNAs, and its activity was inhibited by 1, 4-DPCA, a prolyl-4-hydroxylase inhibitor. Three-dimensional culture assay was used to analyze roles of P4HA2 in regulating malignant phenotypes of breast cancer cells. Reduced deposition of collagen I and IV was detected by Western blotting and immunofluorescence. Control and P4HA2-silenced breast cancer cells were injected into fat pad and tail vein of SCID mice to examine effect of P4HA2 on tumor growth and lung metastasis.

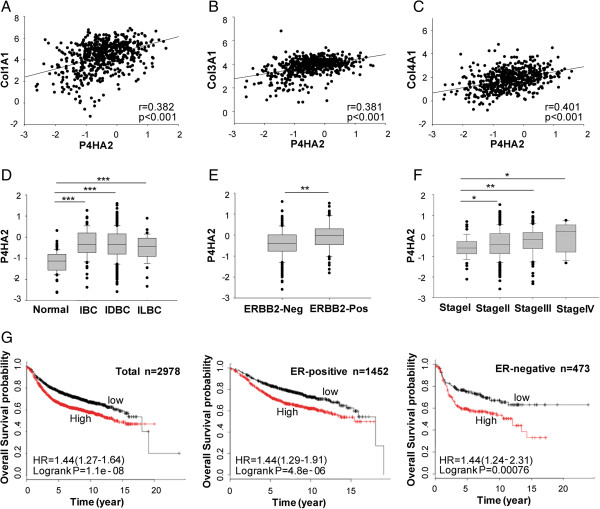
Results: Using gene co-expression analysis, we showed that P4HA2 was associated with expression of Col1A1, Col3A1, and Col4A1 during breast cancer development and progression. P4HA2 mRNA levels were significantly upregulated in breast cancer compared to normal mammary tissue. Increased mRNA levels of P4HA2 correlated with poor clinical outcome in breast cancer patients, which is independent of estrogen receptor status. Silencing P4HA2 expression or treatment with the P4HA inhibitor significantly inhibited cell proliferation and suppressed aggressive phenotypes of breast cancer cells in 3D culture, accompanied by reduced deposition of collagen I and IV. We also found that knockdown of P4HA2 inhibited mammary tumor growth and metastasis to lungs in xenograft models.

Conclusion: These results suggest the critical role of P4HA2 in breast cancer progression and identify P4HA2 as a potential therapeutic target and biomarker for breast cancer progression.


Figures

Figure 1
Figure 1
P4HA2 is associated with collagen expression and poor prognosis in human breast cancer. (A-C) Scatterplot of correlated mRNA levels between P4HA2 and (A)Col1A1, (B)Col3A1, and (C)Col4A1 in normal and malignant breast tissues (n = 593). The mRNA levels of P4HA2 were acquired from the TCGA microarray dataset generated from human breast cancer. (D)P4HA2 mRNA levels in IBC (invasive breast carcinoma) (n = 76), IDBC (invasive ductal breast carcinoma) (n = 398) and ILBC (invasive lobular breast carcinoma) (n = 36) is higher than normal breast tissue (n = 61). (E)P4HA2 mRNA expression is higher in ERBB2 (epidermal growth factor receptor 2) negative tumors than in ERBB2-positive cancer tissues. (F)P4HA2 mRNA levels are associated with stages of breast cancer. (G) Kaplan-Meier survival analysis showed the association between P4HA2 expression and clinical outcomes. Breast cancer patients were grouped by ER status (ER-positive, n = 1452; ER-negative, n = 473). Tumor samples were classified into low and high P4HA2 expression based on the mRNA levels. Tumor had high P4HA2 expression levels in a shorter overall survival period. The association of P4HA2 expression and clinical outcome is ER status independent (*p < 0.05; **p < 0.01; ***p < 0.001).
Figure 2
Figure 2
Silencing P4HA2 reduces colony size and proliferation of breast cancer cells in 3D culture. (A) P4HA2 knockdown efficiency in T4-2 cells was verified by Western blot. (B) Phase images of control shRNA (shctrl) and shP4HA2-expressing ZR-75-1 and T4-2 cells in 3D culture for 4 days. The right column shows immunofluorescence images of α6-integrin (green) and DAPI (blue) staining. P4HA2-silenced T4-2 cells formed polarized acinar structures (arrows pointing to basal surface staining of α6-integrin), whereas control T4-2 cells still maintained disorganized mass-like structures (arrows pointing to lateral staining of α6-integrin; scale bar, 50 μm). (C) Ratio of polarized colony in control and knockdown P4HA2 T4-2 cells in 3D culture. (D) Quantification of colony size of control and P4HA2-silenced ZR-75-1 and T4-2 cells in 3D culture by measuring the diameter of at least 50 colonies. Knockdown of P4HA2 decreased the colony size. (E) EdU-staining was used to analyze the proliferation of control and P4HA2-silenced ZR-75-1 and T4-2 cells in 3D culture. Knockdown P4HA2 inhibited the proliferation of ZR-75-1 and T4-2 cells (*p < 0.05; **p < 0.01).
Figure 3
Figure 3
Knockdown of P4HA2 suppresses breast cancer cells invasiveness in 3D culture. (A) Phase images of control and P4HA2-silenced MDA-MB-157 and MDA-MB-231 cells in 3D culture for 4 days. The right column shows immunofluorescence images of F-actin (red) and DAPI (blue) staining. P4HA2-silenced MDA-MB-157 and MDA-MB-231 cells formed smaller and less invasive cell clusters than control cells (scale bar, 50 μm). (B) Quantification of the invasive branches of control and P4HA2-silenced MDA-MB-157 and MDA-MB-231 cells in 3D culture by counting the branches in at least 50 colonies. Knockdown of P4HA2 reduced the invasive branches. (C) EdU-staining was used to analyze the proliferation of control and P4HA2 knockdown MDA-MB-231 cells in 3D culture. Knockdown of P4HA2 had little effect on the proliferation of MDA-MB-231 cells (**p < 0.01). (D) Transwell cell invasion assay analysis of control and P4HA2-silenced MDA-MB-231 cells (scale bar, 200 μm). (E) Quantification of invasion analysis of control and P4HA2-silenced MDA-MB-231 cells. Knockdown P4HA2 significantly inhibited cell invasion in MDA-MB-231 cells compared with control group.
Figure 4
Figure 4
Treatment with P4HA inhibitor attenuates breast cancer cell proliferation and invasiveness. (A) Phase images of control and 1,4-DPCA treated ZR-75-1 (20 μM 1,4-DPCA), T4-2 (10 μM 1,4-DPCA), MDA-MB-157 (20 μM 1,4-DPCA) and MDA-MB-231 (10 μM 1,4-DPCA) cells in 3D culture. The cells treated with 1,4-DPCA formed smaller and less aggressive structures compared to control cells (scale bar, 50 μm). (B) Quantification of colony size of control and 1,4-DPCA treated ZR-75-1 and T4-2 cells in 3D culture by measuring the diameter of at least 50 colonies. Treatment with 1,4-DPCA reduced the colony size. (C) Ratio of polarized colonies in control and 1,4-DPCA treated T4-2 cells in 3D culture. (D) Quantification of the invaded branches of control and the 1,4-DPCA treated MDA-MB-157 and MDA-MB-231 cells in 3D culture by measuring the branches in at least 50 colonies. Cells treated with 1,4-DPCA had decreased invasive branch number. (E) EdU-staining was used to analyze the proliferation of control and the 1,4-DPCA treated ZR-75-1, T4-2, MDA-MB-157 and MDA-MB-231 cells in 3D culture. Treatment with 1,4-DPCA decreased proliferation of these four cell lines (*p < 0.05; **p < 0.01).
Figure 5
Figure 5
Reducing P4HA2 expression or inhibiting its activity impairs collagen deposition. (A) Western blot analysis of collagen I and IV in conditional media generated from the same amount of control and P4HA2-silenced (sh-P4HA2-1) T4-2 cells; bar graph shows quantification of Western blot results (*p < 0.05; **p < 0.01) (B) Immunofluorescence staining of collagen I (green) and IV (green) in control and P4HA2-silenced T4-2 cells. P4HA2 knockdown (sh-P4HA2-1) T4-2 cells showed impaired collagen I and IV protein deposition. (C) Immunofluorescence staining of collagen I (green) and IV (green) in control and 1,4-DPAC treated T4-2 cells in 3D culture. T4-2 cells treated with 1,4-DPAC showed lower expression of collagen I and IV (scale bar, 50 μm).
Figure 6
Figure 6
Knockdown of P4HA2 suppresses tumor growth and metastasis in vivo. (A) Control or P4HA2-silenced (sh-P4HA2-1) MDA-MB-231/Luciferase cells were injected into the mammary fat pad in SCID mice. IVIS images show representative mice from each group (n = 6). (B) Tumor growth curve shows that knockdown of P4HA2 (sh-P4HA2-1) inhibited tumor growth in SCID mice (n = 6). (C) Tumor volume formed by p4HA2 knockdown (sh-P4HA2-1) cells was significantly reduced compared with control MDA-MB-231/Luc cells. Tumor volume was obtained by quantifying IVIS images. (D) Tumor sections were stained with hematoxylin and eosin. Arrows point to invasion area at primary tumor margins (scale bar, 200 μm). (E) Masson’s Trichrome staining of tumor sections (blue, collagen fibers; black, nuclei; red, cytoplasm). A significant amount of collagen fibers (arrows) were detected in the control tumors, but not in the P4HA2-silenced (sh-P4HA2-1) tumors (scale bar, 200 μm). The right bar graph is the quantification of Masson’s Trichrome staining results. (F) Mice received a tail vein injection of control or P4HA2 knockdown (sh-P4HA2-1) MDA-MB-231/Luc cells (n = 5). IVIS image showed lung metastasis of control and P4HA2-silenced (sh-P4HA2-1) MDA-MB-231 cells in SCID mice. Lung metastasis can be detected in control but not in the knockdown P4HA2 group (*p < 0.05). (G) Lung colonization was analyzed by hematoxylin and eosin staining. Arrows point to the tumor formed in control group lung tissue (Scale bar, 500 μm).

References

    1. Bissell MJ, Hines WC. Why don’t we get more cancer? A proposed role of the microenvironment in restraining cancer progression. Nat Med. 2011;17(3):320–329. doi: 10.1038/nm.2328. - DOI - PMC - PubMed
    1. Lu P, Weaver VM, Werb Z. The extracellular matrix: a dynamic niche in cancer progression. J Cell Biol. 2012;196(4):395–406. doi: 10.1083/jcb.201102147. - DOI - PMC - PubMed
    1. Muschler J, Streuli CH. Cell-matrix interactions in mammary gland development and breast cancer. Cold Spring Harbor Perspect Biol. 2010;2(10):a003202. - PMC - PubMed
    1. Lochter A, Bissell MJ. Involvement of extracellular matrix constituents in breast cancer. Semin Cancer Biol. 1995;6(3):165–173. doi: 10.1006/scbi.1995.0017. - DOI - PubMed
    1. Provenzano PP, Eliceiri KW, Campbell JM, Inman DR, White JG, Keely PJ. Collagen reorganization at the tumor-stromal interface facilitates local invasion. BMC Med. 2006;4(1):38. doi: 10.1186/1741-7015-4-38. - DOI - PMC - PubMed

Publication types

MeSH terms