

Mapping amyotrophic lateral sclerosis lake risk factors across northern New England
- PMID: 24383521
- PMCID: PMC3922844
- DOI: 10.1186/1476-072X-13-1
Mapping amyotrophic lateral sclerosis lake risk factors across northern New England
Abstract
Background: Amyotrophic lateral sclerosis (ALS) is a progressive, fatal neurodegenerative disease with a lifetime risk of developing as 1 in 700. Despite many recent discoveries about the genetics of ALS, the etiology of sporadic ALS remains largely unknown with gene-environment interaction suspected as a driver. Water quality and the toxin beta methyl-amino-alanine produced by cyanobacteria are suspected environmental triggers. Our objective was to develop an eco-epidemiological modeling approach to characterize the spatial relationships between areas of higher than expected ALS incidence and lake water quality risk factors derived from satellite remote sensing as a surrogate marker of exposure.
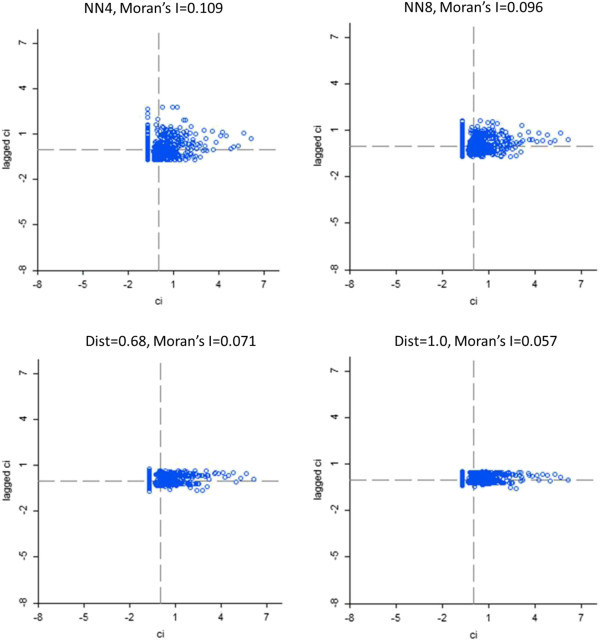
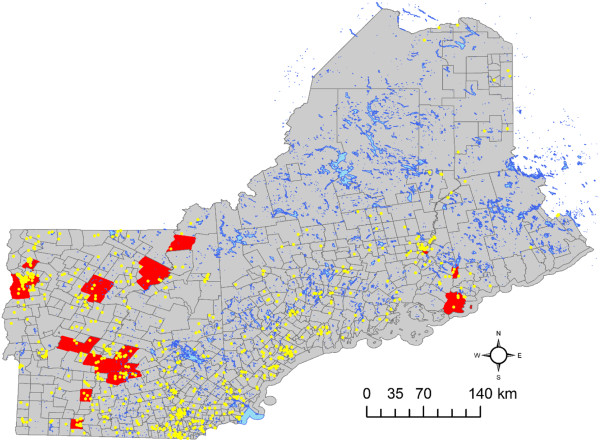
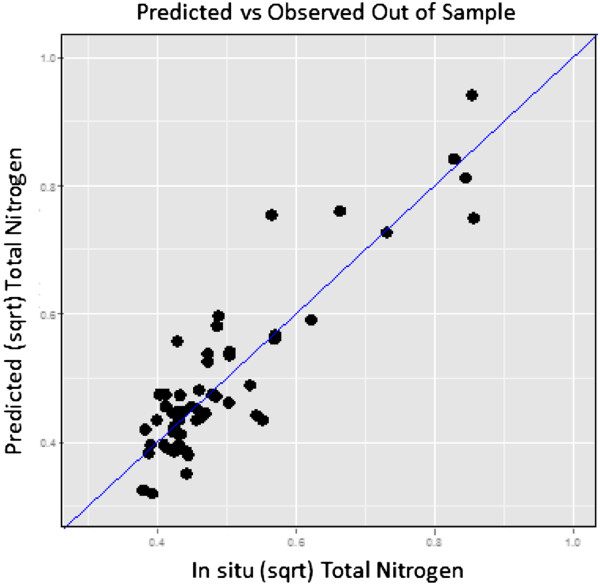
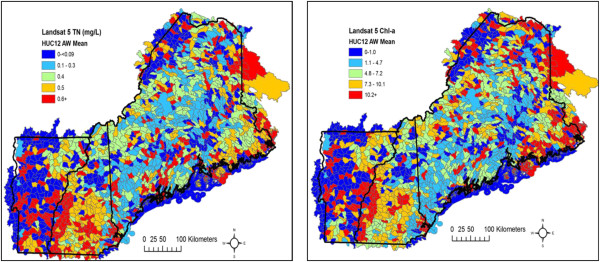
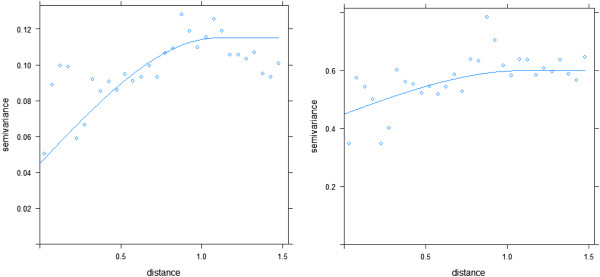
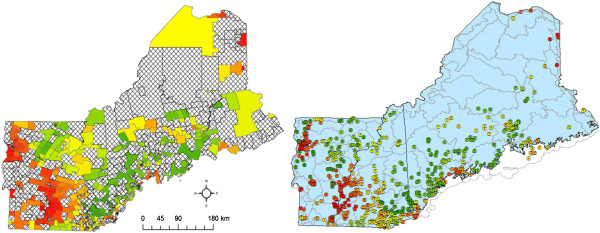
Methods: Our eco-epidemiological modeling approach began with implementing a spatial clustering analysis that was informed by local indicators of spatial autocorrelation to identify locations of normalized excess ALS counts at the census tract level across northern New England. Next, water quality data for all lakes over 6 hectares (n = 4,453) were generated using Landsat TM band ratio regression techniques calibrated with in situ lake sampling. Derived lake water quality risk maps included chlorophyll-a (Chl-a), Secchi depth (SD), and total nitrogen (TN). Finally, a spatially-aware logistic regression modeling approach was executed characterizing relationships between the derived lake water quality metrics and ALS hot spots.
Results: Several distinct ALS hot spots were identified across the region. Remotely sensed lake water quality indicators were successfully derived; adjusted R² values ranged between 0.62-0.88 for these indicators based on out-of-sample validation. Map products derived from these indicators represent the first wall-to-wall metrics of lake water quality across the region. Logistic regression modeling of ALS case membership in localized hot spots across the region, i.e., census tracts with higher than expected ALS counts, showed the following: increasing average SD within a radius of 30 km corresponds with a decrease in the odds of belonging to an ALS hot spot by 59%; increasing average TN within a radius of 30 km and average Chl-a concentration within a radius of 10 km correspond with increased odds of belonging to an ALS hot spot by 167% and 4%, respectively.
Conclusions: The strengths of satellite remote sensing information can help overcome traditional field limitations and spatiotemporal data gaps to provide the public health community valuable exposure data. Geographic scale needs to be diligently considered when evaluating relationships among ecological processes, risk factors, and human health outcomes. Broadly, we found that poorer lake water quality was significantly associated with increased odds of belonging to an ALS cluster in the region. These findings support the hypothesis that sporadic ALS (sALS) can, in part, be triggered by environmental water-quality indicators and lake conditions that promote harmful algal blooms.
Figures
References
-
- Mitsumoto H, Chad DA, Pioro EP. Amyotrophic lateral sclerosis. F.A. Davis Company: Philadelphia, Pennsylvania; 1998.
-
- Nelson LM, McGuire V. In: Amyotrophic lateral sclerosis. 2. Brown RH, Meininger V, Swash M, editor. London, England: Parthenon Publishing, Informa Healthcare; 2006.
Publication types
MeSH terms
Grants and funding
LinkOut - more resources
Full Text Sources
Other Literature Sources
Medical
Miscellaneous
