. 2014 Mar 1;101(3):364-72.
doi: 10.1093/cvr/cvt342. Epub 2014 Jan 2.

Glycaemic control improves perfusion recovery and VEGFR2 protein expression in diabetic mice following experimental PAD

Affiliations

Glycaemic control improves perfusion recovery and VEGFR2 protein expression in diabetic mice following experimental PAD

Ayotunde O Dokun et al. Cardiovasc Res. .

Abstract

Aims: Diabetes mellitus (DM) is associated with poor clinical outcomes in humans with peripheral arterial disease (PAD) and in pre-clinical models of PAD, but the effects of glycaemic control are poorly understood. We investigated the effect of glycaemic control on experimental PAD in mice with Type 1 DM and explored the effects of hyperglycaemia on vascular endothelial growth factor receptor 2 (VEGFR2) expression in ischaemia.

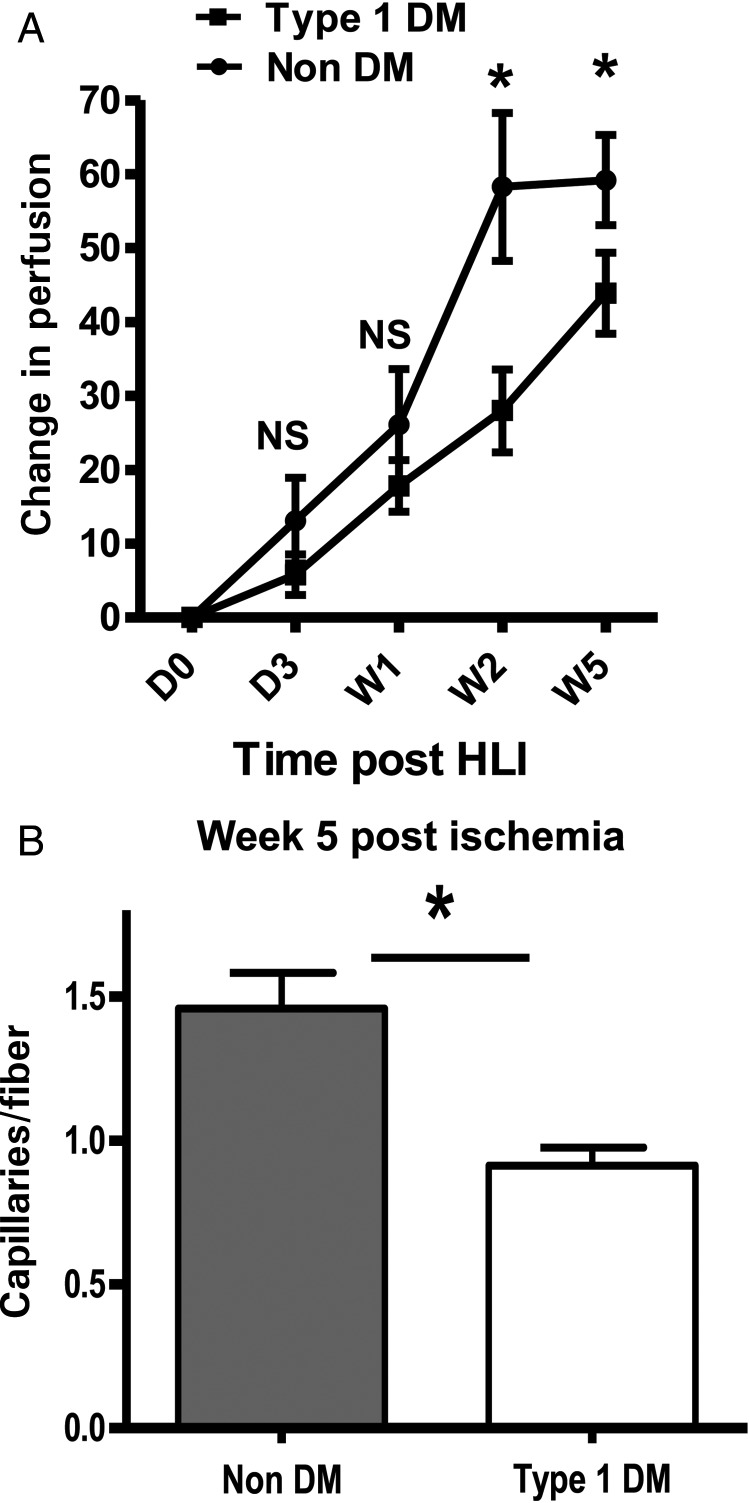
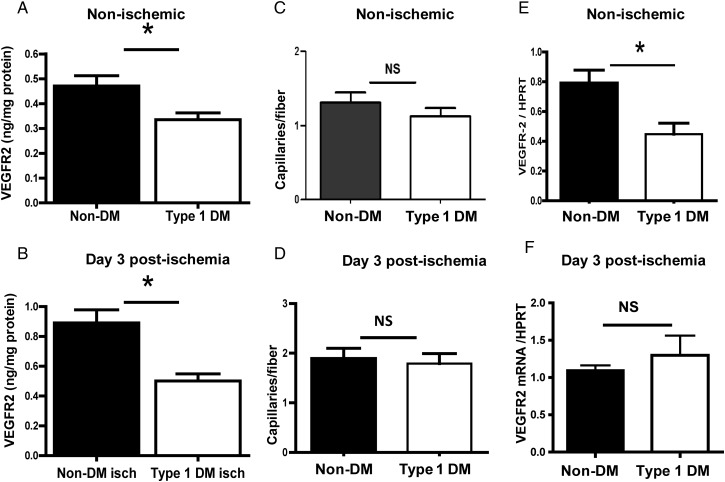
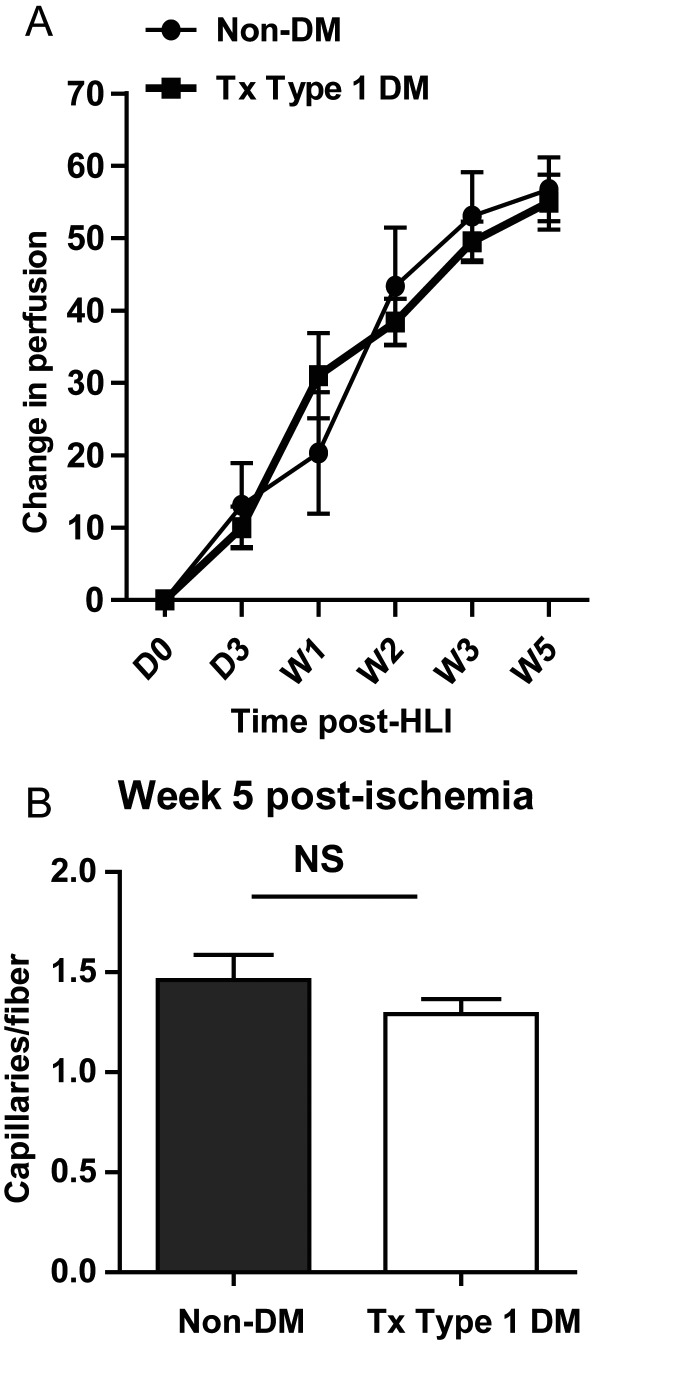
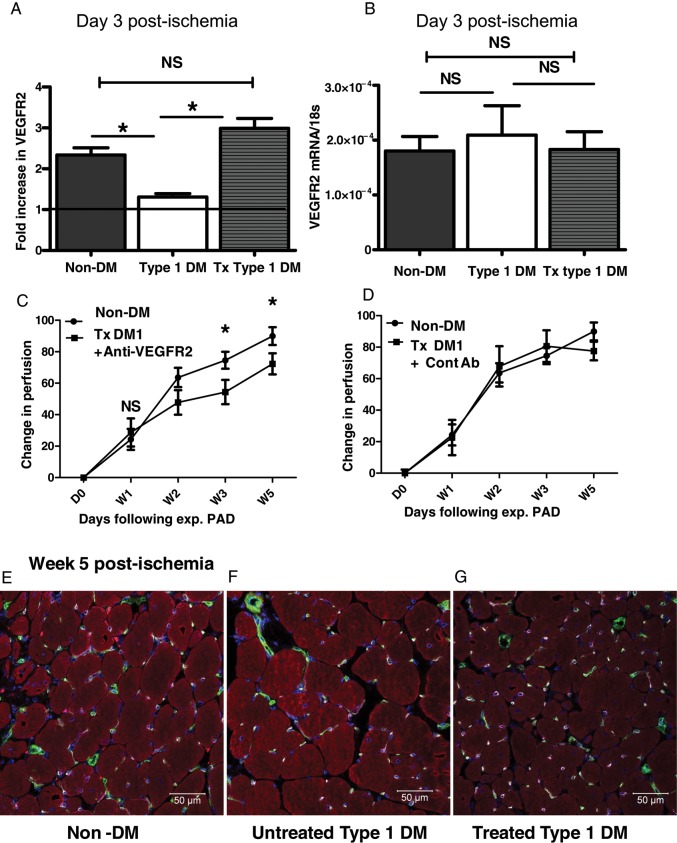
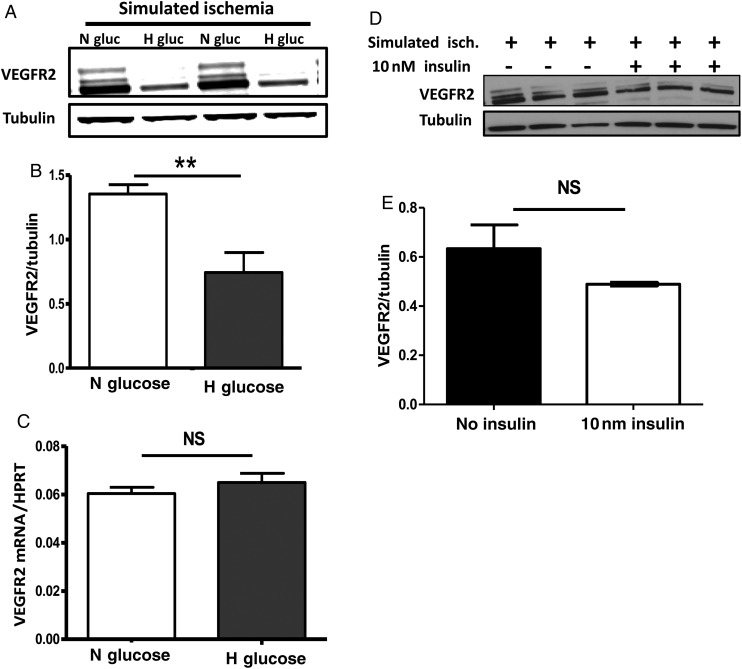
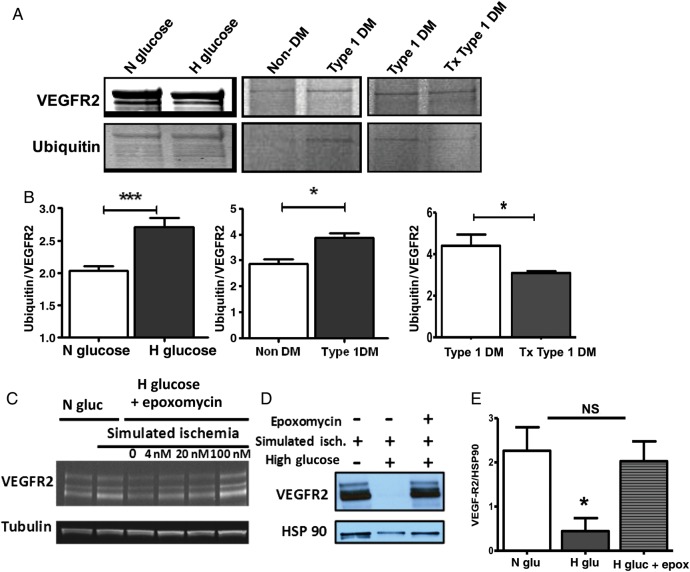
Methods and results: Hind limb ischaemia was induced in non-diabetic, untreated Type 1 DM, and treated Type 1 DM mice. We assessed perfusion recovery, capillary density, VEGFR2 levels, and VEGFR2 ubiquitination in ischaemic hind limbs. We found that untreated Type 1 DM mice showed impaired perfusion recovery, lower hind limb capillary density 5 weeks post-ischaemia, and lower VEGFR2 protein in Day 3 post-ischaemic hind limbs when compared with non-DM controls. Treated Type 1 DM mice had perfusion recovery, capillary density, and VEGFR2 protein levels comparable with that of non-diabetic mice at the same time points. Treatment with anti-VEGFR2 antibody negated that the improved perfusion recovery displayed by treated Type 1 DM mice. In ischaemic Type 1 DM hind limbs and endothelial cells exposed to simulated ischaemia, high glucose impaired VEGFR2 expression and was associated with increased VEGFR2 ubiquitination. Inhibition of the ubiquitin-proteasome complex restored normal endothelial VEGFR2 expression in simulated ischaemia.

Conclusion: Hyperglycaemia in Type 1 DM impairs VEGFR2 protein expression in ischaemic hind limbs, likely due to increased ubiquitination and degradation by the proteasome complex. Glycaemic control allows normal levels of VEGFR2 in ischaemia and improved perfusion recovery.

Keywords: Diabetes; Glycaemic control; Hyperglycaemia; Peripheral arterial disease; Proteasome; VEGF receptor.


Figures

Figure 1
Figure 1
Perfusion recovery is impaired in untreated Type 1 DM mice and associated with decreased capillary density in Week 5 post-ischaemic (A) impaired perfusion recovery in untreated type 1 diabetes mellitus (DM1). The Y-axis shows perfusion ischaemic to non-ischaemic limb normalized to values immediately post-surgery, while the X-axis shows time post-surgery (Type 1 DM n = 16–17 and ND control, n = 8, NS = not significant, P > 0.05, *P = 0.006 at W2 and 0.02 at W5). (B) Since maximum perfusion is already achieved at Week 5 post-ischaemia, we compared capillary density in Week 5 post-ischaemic hind limbs from untreated DM1 mice (n = 5) with that from non-DM controls (n = 7) and found lower capillary density (*P = 0.006) in untreated DM1 mice at Week 5.
Figure 2
Figure 2
VEGFR2 expression is impaired in non-ischaemic and Day 3 ischaemic hind limbs of untreated Type 1 DM mice. (A) In non-ischaemic hind limbs, VEGFR2 protein expression is ∼30% less compared with non-DM controls (n = 7, *P = 0.02). (B) In Day 3 ischaemic hind limbs, VEGFR2 protein expression is ∼50% less in untreated Type 1 DM (n = 6) compared with non-DM controls (n = 5, *P = 0.01). Capillary density was comparable between untreated Type 1 DM and non-DM controls in non-ischaemic (C) (Type 1 DM n = 5, non-DM, n = 7, NS, P = 0.33) and ischaemic (D) hind limbs (Type 1 DM n = 5, non-DM n = 7, NS = P = 0.73). (E) In non-ischaemic hind limbs, VEGFR2 mRNA expression was l in untreated Type 1 DM compared with non-DM controls (n = 5/grp, P = 0.004) and may account for the decreased VEGFR2 protein. (F) VEGFR2 mRNA in Day 3 ischaemic hind limbs (n = 4) was not impaired, but comparable with non-DM controls (n = 5, NS, P = 0.44).
Figure 3
Figure 3
(A) Perfusion recovery in treated Type 1 DM mice (n = 21) is comparable with that of non-diabetic controls (n = 8–12). The Y-axis shows the perfusion ratio (ischaemic-to-non-ischaemic limb) normalized to values immediately post-surgery. The X-axis shows the time point at which perfusion was assessed (P > 0.05) at all time points. (B) Capillary density in Week 5 post-ischaemic hind limb muscles of treated Type 1 DM mice (n = 10) is comparable with that of non-diabetic controls (n = 7, NS, P > 0.05).
Figure 4
Figure 4
Treatment of hyperglycaemia improves VEGFR2 expression in ischaemic hind limb muscles of Type 1 DM mice, and neutralizing VEGFR2 abolishes the treatment-related improved perfusion recovery. (A) A fold increase in VEGFR2 protein is comparable in treated Type 1 DM and non-DM controls in Day 3 post-ischaemic hind limb muscles, but impaired in untreated Type 1 DM mice (treated Type 1 DM, n = 7; non-DM controls n = 5; untreated Type 1 DM n = 6, *P < 0.05, NS = not significant, P > 0.05). (B) VEGFR2 mRNA expression by quantitative PCR showed no difference in the level of expression between non-DM, untreated Type 1 DM, and treated Type 1 DM in Day 3 post-ischaemic hind limbs (n = 6, 7, and 5, respectively, NS, P > 0.05). (C) Treatment with a VEGFR2-neutralizing antibody results in impaired perfusion recovery in treated Type 1 DM. The Y-axis shows the perfusion ratio (ischaemic-to-non-ischaemic limb) normalized to values immediately post-surgery, while the X-axis shows time post-surgery [non-DM controls n = 6–7, treated (Tx) type 1 DM n = 8–10, *P = 0.008 at W3 and 0.01 at W, NS, P = 0.99]. (D) Treatment with isotype matched control antibody had no effect on perfusion recovery in treated Type 1 DM mice [non-DM controls n = 7, treated (Tx) Type 1 DM n = 5]. (E, F, and G) Immunostaining of sections from Week 5 post-ischaemic hind limb muscles of non-diabetic control (E), untreated Type 1 DM (F), and Treated Type 1 DM mice (G). It shows co-localization of VEGFR2 expression with CD31-expressing cells (CD31 = green, VEGFR2 = pink, actin = red, blue = nuclear staining, green + pink = white) consistent with endothelial cell expression.
Figure 5
Figure 5
Hyperglycaemia impairs VEGFR2 expression in simulated ischaemia (hypoxia and nutrient deprivation) without altering its mRNA expression. (A) In simulated ischaemia, VEGFR2 protein expression is impaired in HUVECS pre-cultured in high glucose (25 mM or H Gluc) compared with HUVECS cultured in normal glucose (5 mM or N Gluc). (B) Quantization of the bands in A, n = 5/grp, **P < 0.01. (E) In simulated ischaemia, VEGFR2 mRNA by quantitative RT-PCR showed normal expression in HUVECS cultured in high glucose prior to simulated ischaemia exposure (n = 6/grp, NS = not significant, P = 0.33). (D) Insulin treatment did not increase VEGFR2 expression in HUVECs. Cells were cultured in the presence or absence of insulin, and then exposed to simulated ischaemia for 12, 24, 48, and 72 h following an initial overnight starvation in insulin and growth factor-free medium. A representative western blot of VEGFR2 expression following treatment with 10 nM of insulin at 72 h is shown. (E) Quantization of the blot in D (n = 3/grp, NS = not significant, P > 0.05).
Figure 6
Figure 6
(A) VEGFR2 immunoprecipitation followed by anti-ubiquitin western blotting reveals higher VEGFR2 ubiquitination in HUVECs exposed to simulated ischaemia in the setting of high glucose compared with those in the setting of normal glucose (left panel). In vivo, VEGFR2 ubiquitination is higher in ischaemic hind limbs from Type 1 DM mice (middle panel). Insulin treatment results in reduced VEGFR2 ubiquitination in ischaemic hind limbs of Type 1 DM (Tx Type 1 DM, right panel). (B) Ubiquitin-to-VEGFR2 ratio from quantization of VEGFR2 band represented in A (left panel, n = 3 for N glucose and 4 for H glucose, ***P = 0.006; middle panel, n = 3 for non-DM and 4 for Type 1 DM, *P = 0.01; right panel, n = 5 for Type 1 DM and 4 for Tx Type 1 DM, *P = 0.04). (C) Blocking ubiquitin–proteasome degradation with epoxomycin restores VEGFR2 expression in simulated ischaemia in a dose-dependent manner. (D) Representative blot showing VEGFR2 expression in simulated ischaemia restored with epoxomycin treatment. (E) Quantification of the bands in D (N Gluc = normal glucose, H Gluc = high glucose, Epo = epoxomycin, n = 3, *P < 0.05, NS = not significant). Each blot is representative of at least three experiments.

Similar articles

Cited by

References

    1. Melton LJ, Macken KM, Palumbo PJ, Elveback LR. Incidence and prevalence of clinical peripheral vascular disease in a population-based cohort of diabetic patients. Diabetes Care. 1980;3:650–654. - PubMed
    1. Welborn TA, Knuiman M, McCann V, Stanton K, Constable IJ. Clinical macrovascular disease in Caucasoid diabetic subjects: logistic regression analysis of risk variables. Diabetologia. 1984;27:568–573. - PubMed
    1. Selvin E, Wattanakit K, Steffes MW, Coresh J, Sharrett AR. HbA1c and peripheral arterial disease in diabetes. Diabetes Care. 2006;29:877–882. - PubMed
    1. Jude EB, Eleftheriadou I, Tentolouris N. Peripheral arterial disease in diabetes—a review. Diabetic Med. 2010;27:4–14. - PubMed
    1. UKPDS Group. Intensive blood-glucose control with sulphonylureas or insulin compared with conventional treatment and risk of complications in patients with type 2 diabetes (UKPDS 33) The Lancet. 1998;352:837–853. - PubMed

Publication types

MeSH terms

Substances