. 2014 Feb 21;289(8):5013-24.
doi: 10.1074/jbc.M113.534651. Epub 2014 Jan 2.

Gene model 129 (Gm129) encodes a novel transcriptional repressor that modulates circadian gene expression

Affiliations

Gene model 129 (Gm129) encodes a novel transcriptional repressor that modulates circadian gene expression

Yunus Annayev et al. J Biol Chem. .

Abstract

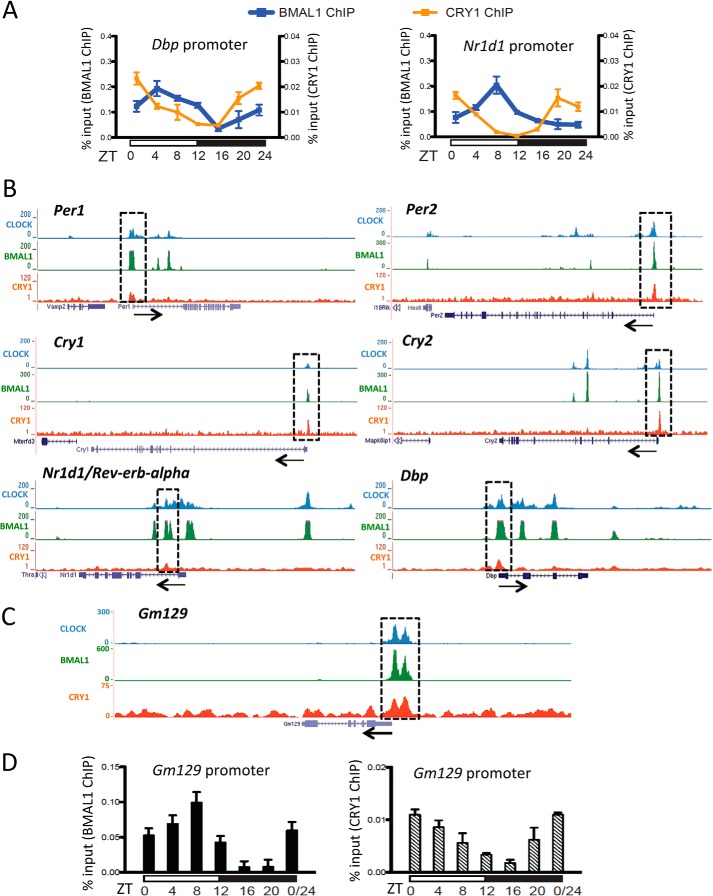
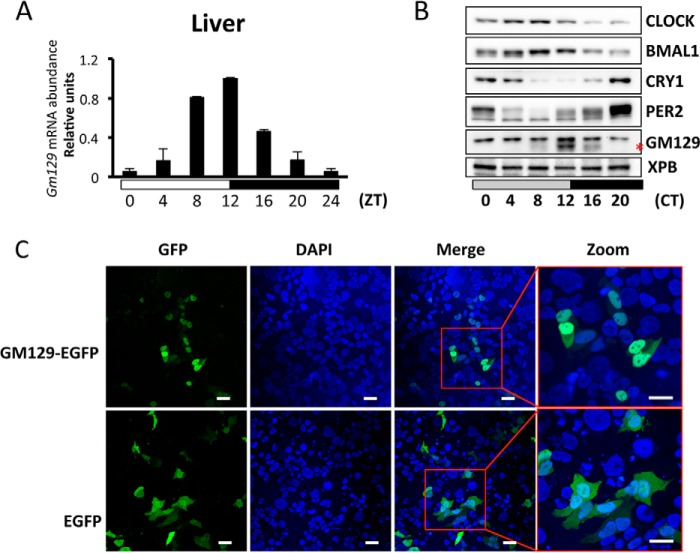
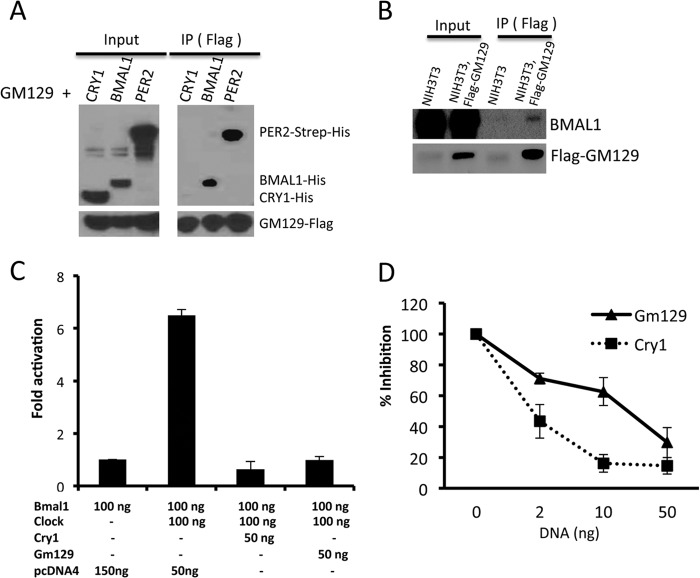
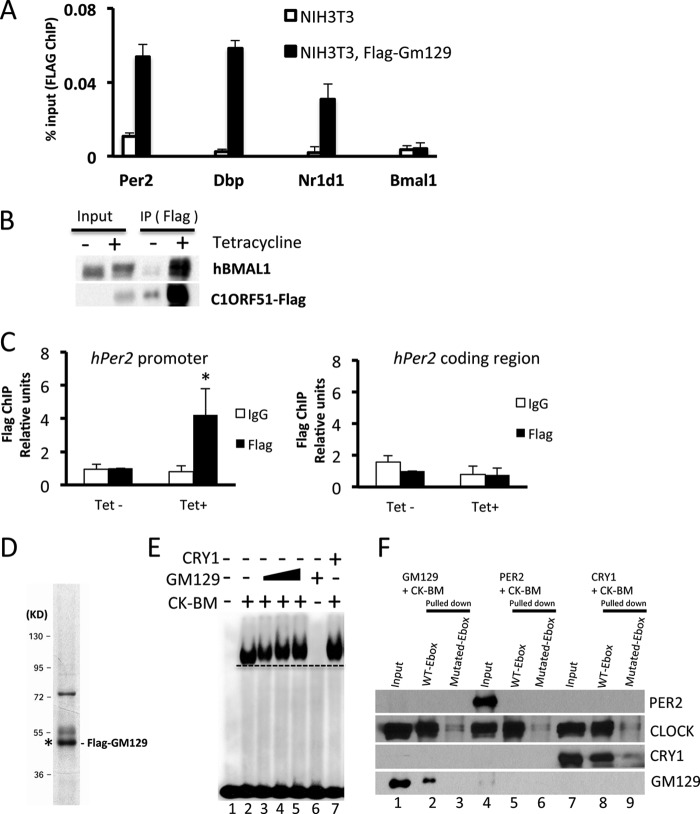
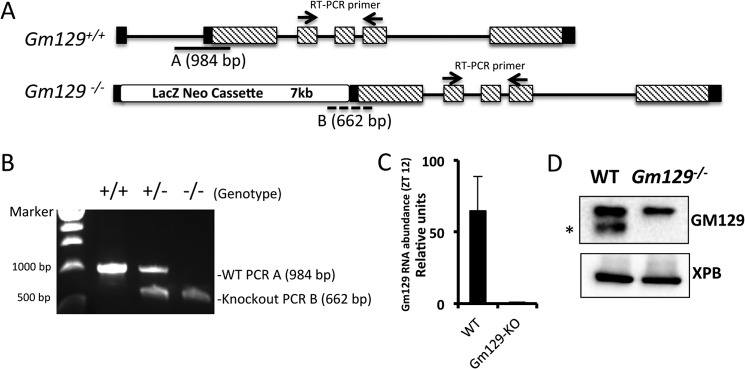
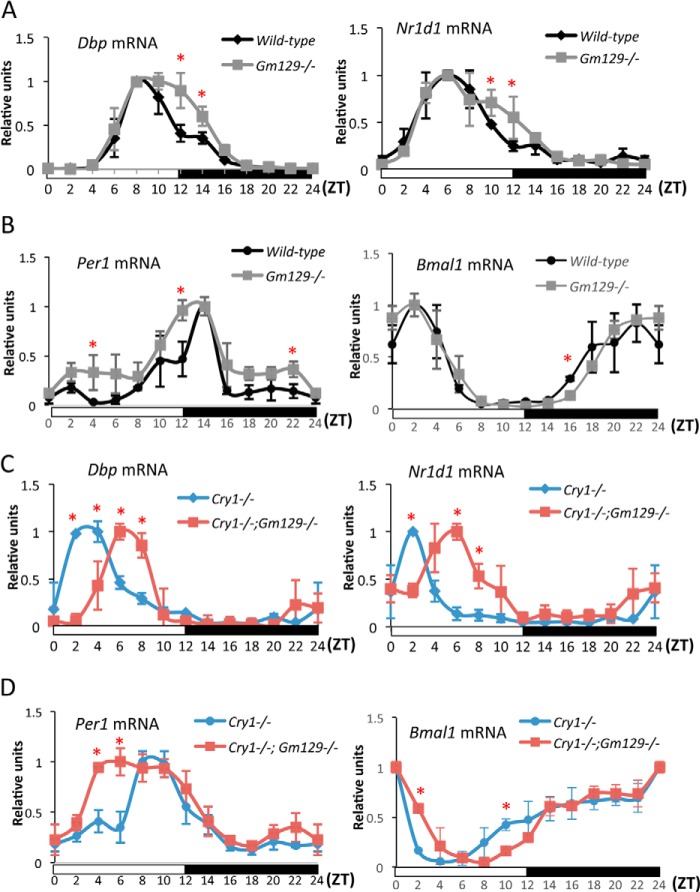
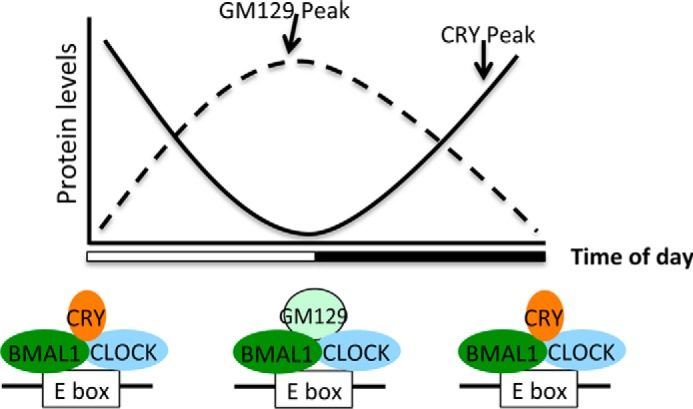
The mammalian circadian clock is a molecular oscillator composed of a feedback loop that involves transcriptional activators CLOCK and BMAL1, and repressors Cryptochrome (CRY) and Period (PER). Here we show that a direct CLOCK·BMAL1 target gene, Gm129, is a novel regulator of the feedback loop. ChIP analysis revealed that the CLOCK·BMAL1·CRY1 complex strongly occupies the promoter region of Gm129. Both mRNA and protein levels of GM129 exhibit high amplitude circadian oscillations in mouse liver, and Gm129 gene encodes a nuclear-localized protein that directly interacts with BMAL1 and represses CLOCK·BMAL1 activity. In vitro and in vivo protein-DNA interaction results demonstrate that, like CRY1, GM129 functions as a repressor by binding to the CLOCK·BMAL1 complex on DNA. Although Gm129(-/-) or Cry1(-/-) Gm129(-/-) mice retain a robust circadian rhythm, the peaks of Nr1d1 and Dbp mRNAs in liver exhibit a significant phase delay compared with control. Our results suggest that, in addition to CRYs and PERs, the GM129 protein contributes to the transcriptional feedback loop by modulating CLOCK·BMAL1 activity as a transcriptional repressor.

Keywords: Circadian; DNA-binding Protein; Gene Regulation; Signal Transduction; Transcription Repressor.


Figures

FIGURE 1.
FIGURE 1.
Gm129 is a direct target of the CLOCK·BMAL1·CRY complex. A, rhythmic binding of BMAL1 (blue curve) and CRY1 (orange curve) to the Dbp and Nr1d1 promoter regions in mouse liver over one 12-h light/12-h dark cycle. Chromatin immunoprecipitation analysis was conducted using antibodies against BMAL1 and CRY1. Cross-linked chromatins were prepared from mouse liver tissues taken at 4-h intervals in a 24-h cycle. Error bars represent S.D. of 3 biological repeats. B, highly overlapping CLOCK, BMAL1, and CRY1 binding to the Per1, Per2, Cry1, Nr1d1, and Dbp gene. Gene tracks represent binding of CLOCK (blue), BMAL1 (green), and CRY1 (red) to various genes. Gray rectangles highlight co-occupied sites. The scale of the y axis (peak height) is adjusted for individual traces for visual clarity. Beneath each set of gene tracks is a representation of the intron/exon structure. Black arrow indicates the orientation of transcription. C, binding of the CLOCK·BMAL1·CRY1 complex to the promoter region of the Gm129 gene. D, rhythmic binding of BMAL1 (black bars) and CRY1 (dashed bars) to the Gm129 promoter region in mouse liver over one 12-h light/12-h dark cycle. Nuclear extracts were prepared from mouse liver tissues collected at 4-h intervals in a 24-h cycle and subjected to chromatin immunoprecipitation analysis using antibodies against BMAL1 and CRY1. Error bars represent S.D. of 3 biological repeats.
FIGURE 2.
FIGURE 2.
GM129 is a nuclear protein and oscillates in mouse liver. A, circadian oscillation of Gm129 mRNA in mouse liver. Mice were sacrificed at zeitgeber times (ZT) 4, 8, 12, 16, 20, and 24/0 h. The abundance of Gm129 mRNA was determined by quantitative RT-PCR and normalized to that of Gapdh. The maximal value was normalized to 1. Error bars represent S.D. of 2 biological repeats. The 0 to 24-h time point is plotted twice to emphasize the trend. B, oscillation of GM129 and core clock protein levels in liver nuclei. Mice were kept in constant dark for 24 h following 12-h dark/12-h light cycles. After 24 h in the dark, nuclear extracts were prepared from livers collected at 0, 4, 8, 12, 16, and 20 h in dim red light and GM129 was detected by Western blots. The XPB protein was used as a loading control. The GM129 signal is marked by a red asterisk. Note there is a nonspecific antibody cross-reactive band above the GM129 signal. The blot is representative of two experiments. C, subcellular localization of GM129-EGFP fusion protein. HEK293T cells were transfected with plasmid DNA expressing GM129-EGFP protein or EGFP alone. 48 h post-transfection, cells were fixed and visualized by fluorescence microscopy (GFP) and DAPI staining. Nuclear localization was confirmed by merging the GFP signal with the DAPI signal. EGFP alone is a control that localizes to both cytoplasm and nucleus. Bar = 10 μm.
FIGURE 3.
FIGURE 3.
GM129 interacts with BMAL1 and PER2, and represses CLOCK/BMAL1-activated transcription. A, GM129 interacts with BMAL1 and PER2. Sf21 cells were co-infected with FLAG-GM129 baculovirus together with either PER2-Strep-His, BMAL1-His, or CRY1-His baculovirus. Cell extracts were prepared 48 h after infection and subjected to immunoprecipitation (IP) using FLAG resin. Immunoprecipitates were analyzed by Western blot. B, GM129 interacts with endogenous BMAL1 in an NIH3T3 cell line stably expressing FLAG-GM129. Immunoprecipitates obtained with FLAG resin from whole cell lysates were probed by immunoblotting. GM129 and BMAL1 were detected by anti-FLAG anti-BMAL1 antibody, respectively. C, HEK293 cells were transiently transfected with 25 ng of Per1 luciferase reporter construct, 2.5 ng of pBind (for normalization of transfection efficiency), and a total 250 ng of the indicated combinations of Clock, Bmal1, Gm129, and Cry1 expressing constructs together with pcDNA4. Cells were collected 48 h after transfection. Error bars represent S.D. from 3 experimental repeats. D, dose-response studies of inhibition of CLOCK·BMAL1-induced transcription by the GM129 and CRY1 proteins. Three amounts (2, 10, and 50 ng) of the Cry1 and Gm129 plasmids were used in the reporter gene assay. Experiments were done in triplicate and average values are plotted. Error bars represent standard deviation of 3 biological repeats. Note: x-axis is not set to scale.
FIGURE 4.
FIGURE 4.
GM129 binds to CLOCK·BMAL1 on DNA both in vitro and in vivo. A, FLAG-GM129 binding to E-box DNA sequence in the Per2, Dbp, and Nr1d1 promoters was determined by ChIP assays followed by quantitative PCR. Cross-linked nuclear extracts were isolated from cells and subjected to ChIP assay with FLAG antibodies against FLAG-GM129. NIH3T3 cells and Bmal1 promoter region primers were used as controls for immunoprecipitation (IP) and PCR, respectively. Data are expressed as percentage of input. Error bars represent S.D. of 3 experiments. B, interaction of the human homolog of GM129 (C1ORF51) with endogenous hBMAL1 in extracts made from a 293R cell line stably expressing Flag-C1ORF51 under control of a tetracycline inducible promoter (Flp-In/FLAG-C1ORF51 cells). FLAG resin was used to pull down Flag-C1ORF51, and immunoprecipitates (IP) were analyzed by Western blot. Note that Flag-C1ORF51 protein is also enriched by FLAG resin without tetracycline due to the minor leaky expression. C, C1ORF51 binding to the E-box DNA sequence in the hPer2 promoter was determined by ChIP assays followed by quantitative PCR. Cross-linked nuclear extracts were isolated after a 24-h tetracycline induction and subjected to ChIP assay with FLAG antibodies against Flag-C1ORF51 or IgG. Upon tetracycline treatment, Flag-C1ORF51 showed significant recruitment to the hPer2 E-box compared with the IgG control and non-tetracycline controls (left panel, black asterisk: p < 0.05). No significant recruitment was detected in the hPer2 coding region (right panel). Data are expressed as percentage of input. Error bars represent S.D. of 3 experiments. D, Flag-GM129 protein was expressed using the Sf21/baculovirus system. After affinity chromatography purification, protein was analyzed by SDS-PAGE/Coomassie Blue staining. GM129 protein is marked with asterisk confirmed by immunoblotting. E, effects of GM129 on mobility of the CLOCK·BMAL1·E-box complex analyzed by EMSA. A radiolabeled 14-mer E-box duplex (1.5 nm) (M34, Table 1) (35) was incubated with purified BMAL1·CLOCK heterodimer (0.5 nm), and then increasing amounts of GM129 proteins (0.1, 0.5, and 1 nm) were added. Note the addition of GM129 results in slower migration of the protein·DNA complex (lanes 3–5). GM129 alone (1 nm) does not bind to DNA (lane 6). CRY1 (1 nm) was used as a positive control to show the shifted CLOCK·BMAL1·CRY1 complex on DNA. A dashed line parallel to the leading edge of the CLOCK·BMAL1·E-box complex is drawn to indicate the change in mobility of the protein·DNA bands upon addition of GM129 and CRY1. F, GM129 binds to the CLOCK·BMAL1·E-box determined by in vitro pulldown assays. The CLOCK·BMAL1 complex (10 nm) was mixed with 10 nm GM129, PER2, or CRY1 protein, then 500 ng of immobilized 30-mer WT E-box or mutated E-box duplex DNA was added for an additional 60-min incubation in binding buffer. Immobilized complexes were washed and then protein·DNA complexes were eluted and analyzed by Western blot. Proteins were detected by anti-CLOCK or anti-FLAG (GM129, PER2, and CRY1) antibodies.
FIGURE 5.
FIGURE 5.
Generation of Gm129 knock-out mice. A, schematic representation of the WT (Gm129+/+) allele and targeted allele (Gm129−/−). Homologous recombination leads to the insertion of a 7-kb LacZ and Neomycin cassette between exon 1 and exon 2 in the WT Gm129 allele. Black lines represent introns. Black and dashed rectangles represent non-coding and coding exons, respectively. Solid line A and dashed line B locate the products of PCR genotyping. Two small arrows show the location of the primers used for RT-PCR (Table 1). B, primers were designed as indicated in Fig. 5A and Table 1 for genotyping. 984- and 662-bp PCR products were amplified using WT, heterozygote or knock-out mouse tail genomic DNA, respectively. C, Gm129 gene expression (normalized to Gapdh) in WT and Gm129−/− mice. The value of Gm129 expression in knock-out mice was set to 1. Error bars represent S.D. of 3 biological repeats. D, GM129 protein deficiency in Gm129−/− mouse liver. Liver nuclear extracts were prepared from wild-type (Gm129+/+) or homozygous Gm129−/− mutant mice at ZT12 and analyzed by SDS-PAGE followed by immunoblotting. The GM129 signal is marked by a black asterisk. XPB is a loading control.
FIGURE 6.
FIGURE 6.
Effects of disruption of the Gm129 gene on circadian gene expression in mouse liver. A and B, circadian expression of Dbp, Nr1d1, Per1, and Bmal1 in liver from wild-type (black curve) and Gm129−/− (gray curve) mice analyzed by quantitative RT-PCR. C and D, circadian expression of Dbp, Nr1d1, Per1, and Bmal1 in Cry−/− (blue curve) and Cry−/−Gm129−/− (red curve) mouse livers analyzed by quantitative RT-PCR. Liver samples were collected every 2 h from mice that were housed under 12-h light/12-h dark conditions. Dbp and Nr1d1 mRNA levels were first normalized to Gapdh expression. Then, the maximal value of gene expression in the day/night cycle was normalized to 1. Error bars represent S.D. of two biological repeats. Red asterisk indicates significantly altered Dbp, Nr1d1, Per1, and Bmal1 transcription in livers from Gm129−/− and Cry−/−Gm129−/− mice compared with control (p < 0.05).
FIGURE 7.
FIGURE 7.
Model for the role of GM129 in modulating CLOCK·BMAL1 activities. Both GM129 and Cryptochromes could repress he transcription activator CLOCK·BMAL by similar mechanisms but at different times. Cryptochromes reach their peak protein expression levels at ZT20-ZT24, and the GM129 protein has peak expression at ZT12. Thus, GM129 and CRYs regulate the molecular clock in two separate time windows.

References

    1. Bell-Pedersen D., Cassone V. M., Earnest D. J., Golden S. S., Hardin P. E., Thomas T. L., Zoran M. J. (2005) Circadian rhythms from multiple oscillators. Lessons from diverse organisms. Nat. Rev. Genet. 6, 544–556 - PMC - PubMed
    1. Young M. W., Kay S. A. (2001) Time zones. A comparative genetics of circadian clocks. Nat. Rev. Genet. 2, 702–715 - PubMed
    1. Takahashi J. S., Hong H. K., Ko C. H., McDearmon E. L. (2008) The genetics of mammalian circadian order and disorder. Implications for physiology and disease. Nat. Rev. Genet. 9, 764–775 - PMC - PubMed
    1. Reppert S. M., Weaver D. R. (2002) Coordination of circadian timing in mammals. Nature 418, 935–941 - PubMed
    1. Hughes M. E., DiTacchio L., Hayes K. R., Vollmers C., Pulivarthy S., Baggs J. E., Panda S., Hogenesch J. B. (2009) Harmonics of circadian gene transcription in mammals. PLoS Genet. 5, e1000442. - PMC - PubMed

Publication types

MeSH terms

Associated data