. 2013 Nov 25;203(4):643-56.
doi: 10.1083/jcb.201303052.

Dysbindin is a potent inducer of RhoA-SRF-mediated cardiomyocyte hypertrophy

Affiliations

Dysbindin is a potent inducer of RhoA-SRF-mediated cardiomyocyte hypertrophy

Ashraf Yusuf Rangrez et al. J Cell Biol. .

Abstract

Dysbindin is an established schizophrenia susceptibility gene thoroughly studied in the context of the brain. We have previously shown through a yeast two-hybrid screen that it is also a cardiac binding partner of the intercalated disc protein Myozap. Because Dysbindin is highly expressed in the heart, we aimed here at deciphering its cardiac function. Using a serum response factor (SRF) response element reporter-driven luciferase assay, we identified a robust activation of SRF signaling by Dysbindin overexpression that was associated with significant up-regulation of SRF gene targets, such as Acta1 and Actc1. Concurrently, we identified RhoA as a novel binding partner of Dysbindin. Further phenotypic and mechanistic characterization revealed that Dysbindin induced cardiac hypertrophy via RhoA-SRF and MEK1-ERK1 signaling pathways. In conclusion, we show a novel cardiac role of Dysbindin in the activation of RhoA-SRF and MEK1-ERK1 signaling pathways and in the induction of cardiac hypertrophy. Future in vivo studies should examine the significance of Dysbindin in cardiomyopathy.


Figures

Figure 1.
Figure 1.
Dysbindin interacts with Myozap. (A) Co-IP of Myozap and Dysbindin. HEK293A cells were transfected with plasmids encoding HA-tagged Myozap and V5-tagged Dysbindin. Immunoprecipitation was performed using EZview Red Anti-HA Affinity Gel as described in the Materials and methods. Empty vector expressing HA was used as a negative control. Precipitated proteins were immunoblotted with V5 antiserum. Dysbindin was coprecipitated with Myozap (lane 2), whereas no signal could be seen with empty vector (lane 1), confirming the interaction between Dysbindin–Myozap. (B) Schematic diagram showing different domain fragments constituting Dysbindin used to map the exact domain responsible for interaction with Myozap. (C) Co-IP was performed using four different fragments of Dysbindin as described in A. Black lines indicate that intervening lanes have been spliced out. (D) Coimmunostaining of Dysbindin with Myozap in untreated, 50 µM phenylephrine (PE)-treated, or 1 µM endothelin-1 (ET)–treated NRVCMs. Nuclei were stained with DAPI, and the immunofluorescence images were captured on a confocal microscope (LSM 510). Arrows indicate colocalization of Dysbindin–Myozap. WB, Western blot. Bars: (top inset) 10 μm; (middle and bottom insets) 20 μm.
Figure 2.
Figure 2.
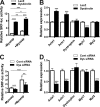
Overexpression of Dysbindin induces SRF signaling in cardiomyocytes. (A) Effect of Myozap and Dysbindin (Dys) on luciferase activity determined by SRF-RE firefly luciferase reporter assay in NRVCMs. Adenoviruses expressing Dysbindin (Ad-Dysbindin), Myozap (Ad-Myozap), SRF-RE reporter–based firefly luciferase (Ad-SRF-luc), and Renilla luciferase (Ad-Renilla, control) were used in NRVCMs. Adenovirus expressing β-galactosidase (Ad-LacZ) was used as a control or to maintain the equal quantity of the infected virus. Virus load used was 20 ifu Ad-Dysbindin, 20 ifu Ad-Myozap, 10 ifu Ad-SRF-luciferase, and 10 ifu Ad-Renilla in different combinations as shown in the figure. Data shown are means of three independent experiments performed in quadruplicates. (B) Expression of cardiac-specific SRF targets such as smooth muscle α-actin (Acta1), cardiac α-actin (Actc1), dystrophin, myosin heavy chain 7 (Myh7), and myosin light chain 2 (Myl2) was determined by qRT-PCR. n = 6. (C) siRNA against Dysbindin was used to knock down the endogenous Dysbindin expression in NRVCMs to study the effect on activation of SRF signaling by luciferase assay. Scrambled unrelated siRNA was used as a control (Cont). Data shown are means of three independent experiments performed in quadruplicates. (D) Expression of cardiac-specific SRF-targets same as in Fig. 2 B, determined by qRT-PCR using cDNA prepared from Dysbindin siRNA-transfected NRVCMs. n = 6. Statistical significance was determined using two-tailed Student’s t test or by two-way ANOVA. Error bars show means ± SEM. *, P < 0.05; **, P < 0.01; ***, P < 0.001.
Figure 3.
Figure 3.
RhoA is a novel binding partner of Dysbindin. (A) A representative picture showing the positive interaction between Dysbindin (Dys) and RhoA determined by Y2H assay. Three colonies were spotted in duplicates, and negative control carries empty prey vector. (B) Co-IP of RhoA and Dysbindin. HEK293A cells were transfected with plasmids encoding HA-tagged RhoA and V5-tagged Dysbindin. Immunoprecipitation was performed using EZview Red Anti-HA Affinity Gel following the manufacturer’s instructions. Empty vector expressing HA was used as a negative control. (C) Endogenous immunoprecipitation performed with proteins isolated from NRVCMs and mouse heart using V5 antibody (as a control) or with Dysbindin. Immunoblotting was performed with RhoA antibody. Black lines indicate that intervening lanes have been spliced out. (D) Coimmunostaining of Dysbindin with RhoA in untreated, 50 µM phenylephrine (PE)-treated, and 1 µM endothelin-1 (ET)–treated NRVCMs. Nuclei were stained with DAPI, and the immunofluorescence images were captured in a confocal microscope (LSM 510). Arrows indicate colocalization of Dysbindin–RhoA. WB, Western blot. Bars: (top inset) 10 μm; (middle and bottom insets) 20 μm.
Figure 4.
Figure 4.
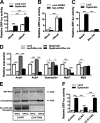
Dysbindin activates SRF signaling via RhoA. (A) Effect of RhoA and Dysbindin on luciferase activity determined by SRF-RE firefly luciferase reporter assay in NRVCMs. Adenoviruses expressing Dysbindin (Ad-Dysbindin), RhoA (Ad-RhoA), SRF-RE reporter-based firefly luciferase (Ad-SRF-luc), and Renilla luciferase (Ad-Renilla, control) were used in NRVCMs. Adenovirus expressing β-galactosidase (Ad-LacZ) was used as a control or to maintain the equal quantity of the infected virus. Infectious units of viruses used were 20 ifu Ad-Dysbindin, 20 ifu Ad-RhoA, 10 ifu Ad-SRF-luciferase, and 10 ifu Ad-Renilla in different combinations as shown in the figure. Data shown are means of two independent experiments performed in hexaplicates. (B) siRNA against Dysbindin (Dys) was used to knockdown endogenous Dysbindin expression in NRVCMs to study the activation of SRF signaling by luciferase assay. Scrambled unrelated siRNA was used as a control. Data shown are means of two independent experiments performed in hexaplicates. cont, control. (C) Effect of Rho inhibitor C3 transferase (commercially available) on luciferase activity. n = 6. (D) Similar conditions as used for C3 transferase treatment in Fig. 4 C were used to study the expression of SRF gene targets such as smooth muscle α-actin (Acta1), cardiac α-actin (Actc1), dystrophin, myosin heavy chain 7 (Myh7), and myosin light chain 2 (Myl2) by qRT-PCR. n = 6. inh, inhibitor. (E) 2 µM GST-RhoA was incubated with the wild-type C3 transferase or mutant protein at various concentrations and 1 µCi [32P]NAD+ in 20 µl of reaction buffer at 37°C for 20 min. The reaction was terminated by addition of Laemmli sample buffer and then incubated at 95°C for 10 min. Samples were resolved by SDS-PAGE on 15% gels, and the ADP-ribosylated RhoA was analyzed by phosphorimaging (no molecular weight marker was run along in the bottom blot). The black line indicates that intervening lanes have been spliced out. WT, wild type. (F) C3 transferase and its point mutant (E174Q) were purified as recombinant GST fusion proteins in E. coli TG1 cells and used for luciferase assays as described in Fig. 4 A. Data shown are means of two experiments performed in triplicates. Statistical significance was determined using two-tailed Student’s t test or two-way ANOVA. Error bars show means ± SEM. *, P < 0.05; **, P < 0.01; ***, P < 0.001.
Figure 5.
Figure 5.
Dysbindin activates the ERK1-dependent MAPK pathway. Cultured NRVCMs were infected with adenovirus expressing Dysbindin (Ad-Dysbindin; 20 ifu) in serum-free media for 72 h and used for protein extraction. Adenovirus expressing β-galactosidase (Ad-LacZ) is used as a control. (A–D) Immunoblotting was performed against ERK1/2 and phospho-ERK1/2 (p-ERK1/2; A), ERK5 and phosphor-ERK5 (B), MAPK p38 and phosphor-p38 (C), and Akt and phosphor-Akt (D). Densitometric analysis was performed using α-actin as a loading control. Data shown are representative of two independent experiments performed in duplicates or triplicates. Statistical significance was determined using two-tailed Student’s t test. Error bars show means ± SEM. *, P < 0.05; **, P < 0.01.
Figure 6.
Figure 6.
Dysbindin induces hypertrophy in cardiomyocytes. (A) Overexpression of Dysbindin was confirmed by immunoblotting in NRVCMs infected with Adenovirus expressing Dysbindin (Ad-Dysbindin; 20 ifu) in serum-free media for 72 h. Adenovirus expressing β-galactosidase (Ad-LacZ) was used as a control. (B) Expression of hypertrophic gene markers Nppa and Nppb was determined using qRT-PCR in Dysbindin-overexpressing NRVCMs. Data shown are means of two independent experiments in hexaplicate. (C) Representative images showing the phenotypic effect of Dysbindin overexpression. NRVCMs were cultured on coverslips in triplicates, infected with Ad-Dysbindin/Ad-LacZ for 72 h, and immunostained with α-actinin. Nuclei were stained with DAPI. (D) Cell size measurements: Cell surface area was measured from randomly selected 300 or more cells from three different coverslips using ImageJ software. Ad-LacZ–infected NRVCMs treated with 50 µM PE were used as a positive control. (E) DNA, protein, and RNA were isolated from LacZ (as a control) or Dysbindin-overexpressing NRVCMs, and protein/DNA and RNA/DNA ratios were determined. n = 6. (F) Representative images showing phenotypic effect of Dysbindin on actin cytoskeleton by FITC-labeled Phalloidin, costained with Dysbindin. Nuclei were stained with DAPI. (G and H) Endogenous expression of Dysbindin (Dys) was knocked down using siRNA. Down-regulation of Dysbindin expression was confirmed in Dysbindin siRNA–transfected as compared with the control (Cont) siRNA–transfected NRVCMs by qRT-PCR (G) and immunoblotting (H). Data shown are means of three independent experiments in triplicate. (I and J) NRVCMs were either untreated as control or treated with 5, 25, or 100 µM PE (I) or 0.3 or 1 µM ET (J) and processed as in Fig. 6 C. Images were captured on Keyence microscope, and cell surface area was measured using MacroCellCount analyzer as detailed in the Materials and methods. Statistical significance was determined using two-tailed Student’s t test or by one/two-way ANOVA. Error bars show means ± SEM. *, P < 0.05; **, P < 0.01; ***, P < 0.001. Bars, 50 μm.
Figure 7.
Figure 7.
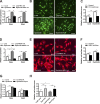
RhoA and ERK1 inhibition abrogates the prohypertrophic effects of Dysbindin. (A) Expression of hypertrophic gene markers Nppa and Nppb was determined by qRT-PCR in Dysbindin-overexpressing NRVCMs in the absence or presence of C3 transferase, a RhoA inhibitor. LacZ-overexpressing cells were used as a control group. n = 6. (B) Representative images showing the phenotypic effect of C3 transferase. NRVCMs were cultured on coverslips in triplicates, infected with Adenovirus expressing Dysbindin/LacZ for 72 h, and immunostained with α-actinin. Nuclei were stained with DAPI. Cells were treated with C3 transferase 12 h before immunostaining. (C) Cell surface area of C3 transferase treatment datasets was measured from randomly selected 300 or more cells from three different coverslips using ImageJ software. (D) Expression of Nppa and Nppb was determined in Ad-LacZ– or Ad-Dysbindin–infected NRVCMs in the absence or presence of MEK1 inhibitor by qRT-PCR. n = 6. (E) Representative images showing the phenotypic effect of MEK1 inhibitor (inh). (F) Cell surface area of MEK1 inhibitor treatment datasets was measured from randomly selected 300 or more cells from three different coverslips using ImageJ software. (G) Expression of Nppa and Nppb was determined in Ad-LacZ– or Ad-Dysbindin–infected NRVCMs in the absence or presence of Cyclosporin A, a Calcineurin inhibitor, by qRT-PCR. n = 6. (H) NRVCMs overexpressing Dysbindin (Dys; or LacZ as control [cont]) were either untreated or treated with Cyclosporine A (Cyclo) and processed as in Fig. 7 B. Immunoimages were captured on Keyence microscope, and cell surface area was measured using MacroCellCount analyzer as detailed in the Materials and methods. Statistical significance was determined using two-tailed Student’s t test or by one/two-way ANOVA. Error bars show means ± SEM. *, P < 0.05; **, P < 0.01; ***, P < 0.001. Bars, 50 μm.
Figure 8.
Figure 8.
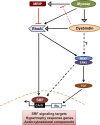
Model figure for Dysbindin-SRF signaling. Dysbindin exhibits two different roles to activate SRF signaling. First, Dysbindin along with Myozap and RhoA itself activates RhoA-dependent SRF signaling, which in turn induce the expression of actin cytoskeleton and hypertrophy response genes. Second, Dysbindin moderately activates interdependent MEK1–ERK1 signaling pathways. Myozap on the other hand can activate RhoA–SRF signaling, which gets inhibited by its interaction with Myosin phosphatase Rho-interacting protein (MRIP). Dysbindin–Myozap interaction possibly hinders Myozap–MRIP interaction, positively and cooperatively activating RhoA–SRF signaling in cardiomyocytes. Ets, E26 transformation specific; TCF, ternary complex factor.

Similar articles

Cited by

References

    1. Allen N.C., Bagade S., McQueen M.B., Ioannidis J.P., Kavvoura F.K., Khoury M.J., Tanzi R.E., Bertram L. 2008. Systematic meta-analyses and field synopsis of genetic association studies in schizophrenia: the SzGene database. Nat. Genet. 40:827–834 10.1038/ng.171 - DOI - PubMed
    1. Benson M.A., Newey S.E., Martin-Rendon E., Hawkes R., Blake D.J. 2001. Dysbindin, a novel coiled-coil-containing protein that interacts with the dystrobrevins in muscle and brain. J. Biol. Chem. 276:24232–24241 10.1074/jbc.M010418200 - DOI - PubMed
    1. Benson M.A., Tinsley C.L., Blake D.J. 2004. Myospryn is a novel binding partner for dysbindin in muscle. J. Biol. Chem. 279:10450–10458 10.1074/jbc.M312664200 - DOI - PubMed
    1. Boerries M., Most P., Gledhill J.R., Walker J.E., Katus H.A., Koch W.J., Aebi U., Schoenenberger C.A. 2007. Ca2+ -dependent interaction of S100A1 with F1-ATPase leads to an increased ATP content in cardiomyocytes. Mol. Cell. Biol. 27:4365–4373 10.1128/MCB.02045-06 - DOI - PMC - PubMed
    1. Bray N.J., Preece A., Williams N.M., Moskvina V., Buckland P.R., Owen M.J., O’Donovan M.C. 2005. Haplotypes at the dystrobrevin binding protein 1 (DTNBP1) gene locus mediate risk for schizophrenia through reduced DTNBP1 expression. Hum. Mol. Genet. 14:1947–1954 10.1093/hmg/ddi199 - DOI - PubMed

Publication types

MeSH terms