. 2013;9(12):e1003398.
doi: 10.1371/journal.pcbi.1003398. Epub 2013 Dec 26.

Metabolic and demographic feedbacks shape the emergent spatial structure and function of microbial communities

Affiliations

Metabolic and demographic feedbacks shape the emergent spatial structure and function of microbial communities

Sylvie Estrela et al. PLoS Comput Biol. 2013.

Abstract

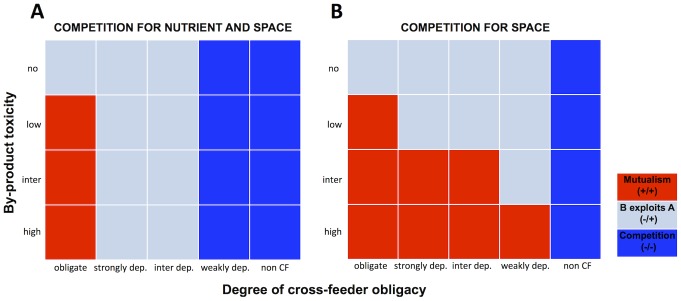
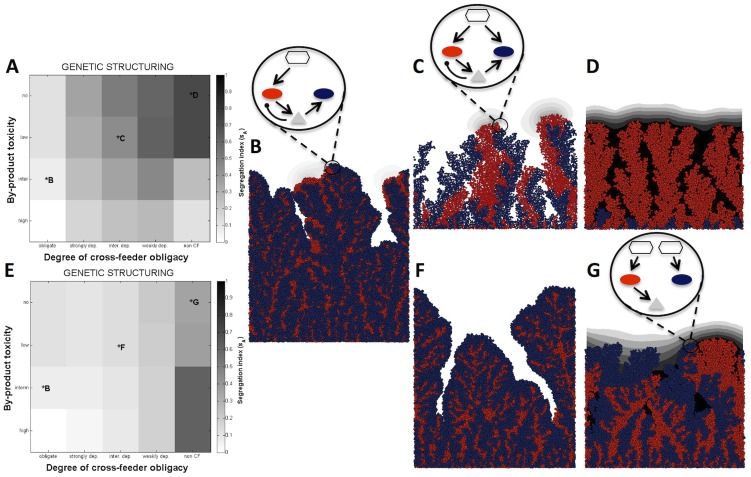
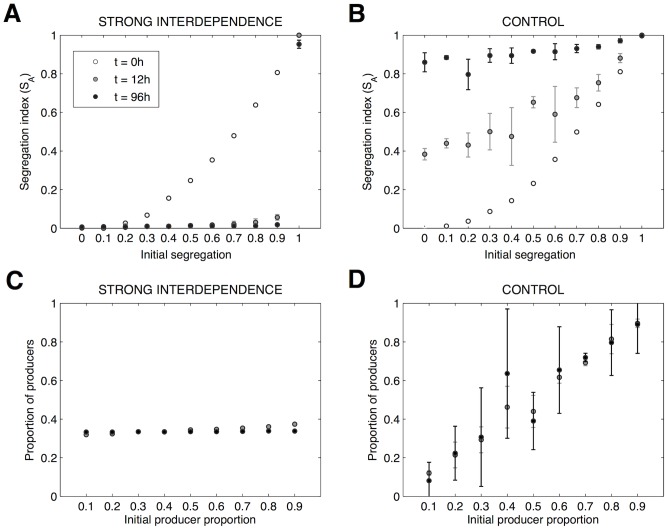
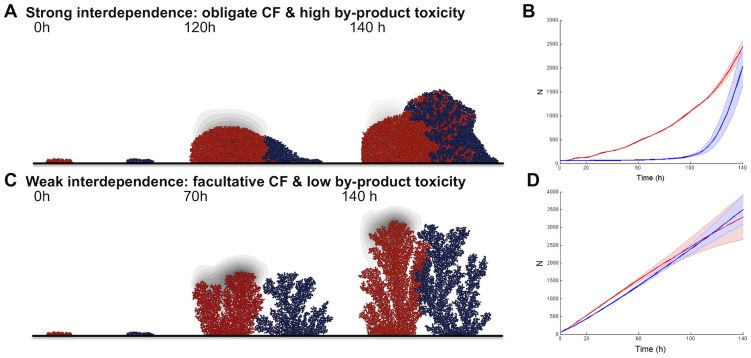
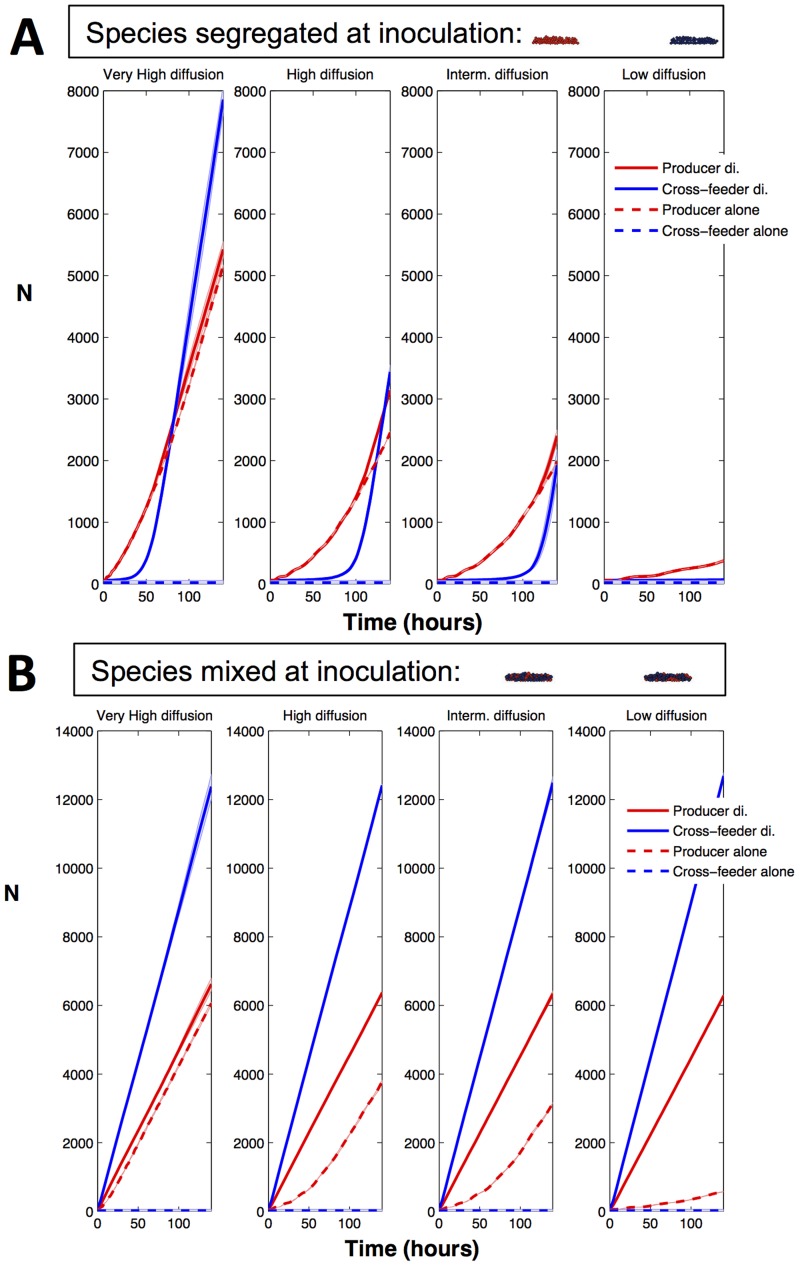
Microbes are predominantly found in surface-attached and spatially structured polymicrobial communities. Within these communities, microbial cells excrete a wide range of metabolites, setting the stage for interspecific metabolic interactions. The links, however, between metabolic and ecological interactions (functional relationships), and species spatial organization (structural relationships) are still poorly understood. Here, we use an individual-based modelling framework to simulate the growth of a two-species surface-attached community where food (resource) is traded for detoxification (service) and investigate how metabolic constraints of individual species shape the emergent structural and functional relationships of the community. We show that strong metabolic interdependence drives the emergence of mutualism, robust interspecific mixing, and increased community productivity. Specifically, we observed a striking and highly stable emergent lineage branching pattern, generating a persistent lineage mixing that was absent when the metabolic exchange was removed. These emergent community properties are driven by demographic feedbacks, such that aid from neighbouring cells directly enhances focal cell growth, which in turn feeds back to neighbour fecundity. In contrast, weak metabolic interdependence drives conflict (exploitation or competition), and in turn greater interspecific segregation. Together, these results support the idea that species structural and functional relationships represent the net balance of metabolic interdependencies.


Conflict of interest statement

The authors have declared that no competing interests exist.

Figures

Figure 1
Figure 1. Metabolic interdependence dictates the ecological outcome of the food for detoxification interaction.
Ecological outcome of interaction for varying by-product toxicity and degree of cross-feeder obligacy when the two species compete for both nutrients and space A, or compete for space only B (see Methods and Text for further details, and fig. S1 for a schematic representation of species interactions). Red indicates mutualism, gray indicates cross-feeder (B) exploits producer (A), and blue indicates competition. CF means cross-feeding.
Figure 2
Figure 2. Metabolic interdependence drives genetic mixing.
Producer segregation index (s A, see Methods) for varying by-product toxicity and degree of cross-feeder obligacy when the two species compete for both nutrients and space A, or compete for space only E. Lighter regions indicate greater mixing (see Methods for further details and fig. S5 for cross-feeder segregation index). Data are the mean of 3 replicates. B–D, F, G. Biofilm images of community growth from one of the associations represented in A or E. Producer is represented in red, and facultative cross-feeder, obligate cross-feeder, and non-cross-feeder are represented in blue. By-product is in gray. The schematics illustrate the metabolic interaction scenarios. Oval, hexagon, and triangle, represent bacteria, main nutrient, and by-product, respectively. Open arrows represent a positive effect, whereas oval arrows represent a negative effect upon the population or resource they are pointing toward. See fig. S1 for a complete schematic representation of all metabolic interaction scenarios.
Figure 3
Figure 3. Strong interdependence generates communities that are robust to variation in initial conditions.
A, B, Emergent population structure (segregation index, s A,) as a function of initial intermixing, for two scenarios. A, strong interdependence (i.e. obligate cross-feeding and high by-product toxicity) and B, no interdependence (control scenario). Population structure is recorded at inoculation (open circles), and after 12 (grey dots) and 96 (black dots) hours. Initial population structure was varied by varying the proportions of producer (species A) and cross-feeder cells (species B) in two adjacent micro-colonies (of size 30 µm separated by a distance of 70 µm) while maintaining a constant total inoculation density and ratio (1∶1). An initial segregation 0 means that each microcolony received equal numbers of A and B, whereas initial segregation of 1 means that one microcolony was pure A and the other pure B. An increment in initial segregation of 0.1 means a 5% increase (or decrease) in the number of cells of species A (or species B) inoculated in each microcolony. C, D. Proportion of producers as a function of initial producer proportion for strong interdependence (i.e. obligate cross-feeding and high by-product toxicity) and control scenario, respectively, and after 12 (grey dots) and 96 (black dots) hours growth (initial segregation = 0). Data are the mean of 3 replicates and error bars are the SD of the mean.
Figure 4
Figure 4. Demographic signatures of functional relationships given initial species segregation.
A, B. The two species are strongly interdependent. C, D. The two species are weakly interdependent. Producer is represented in red and cross-feeder is represented in blue. By-product is in gray. Simulations were initiated with two segregated microcolonies (1∶1). Boundaries on the sides are permeable to the by-product and non-cyclic. B, D. Time series of species biomass (N). The thick lines represent the mean (n = 9) and shaded areas represent the standard deviation.
Figure 5
Figure 5. Effect of varying diffusion and initial segregation on the emergent properties of strongly interdependent communities.
A, The two species are initially segregated. B, The two species are initially mixed. Time series of species biomass (N) when grown in diculture (solid line) or alone (dashed line). The thick lines represent the mean (n = 3) and shaded areas represent the standard deviation. See fig. 3 legend for further details on seeding conditions. By-product diffusion rates are [10DE; 1.4DE; DE; 0.14DE] from very high to low, respectively (see Table S2).

References

    1. Costerton JW, Lewandowski Z, Caldwell DE, Korber DR, Lappin-Scott HM (1995) Microbial biofilms. Annu Rev Microbiol 49: 711–745. - PubMed
    1. Elias S, Banin E (2012) Multi-species biofilms: living with friendly neighbors. FEMS Microbiol Rev 36: 990–1004. - PubMed
    1. Rendueles O, Ghigo JM (2012) Multi-species biofilms: how to avoid unfriendly neighbors. FEMS Microbiol Rev 36: 972–989. - PubMed
    1. Tolker-Nielsen T, Molin S (2000) Spatial Organization of Microbial Biofilm Communities. Microb Ecol 40: 75–84. - PubMed
    1. Murga R, Stewart PS, Daly D (1995) Quantitative analysis of biofilm thickness variability. Biotechnol Bioeng 45: 503–510. - PubMed

Publication types

LinkOut - more resources