. 2013;9(12):e1004018.
doi: 10.1371/journal.pgen.1004018. Epub 2013 Dec 26.

Clustering of tissue-specific sub-TADs accompanies the regulation of HoxA genes in developing limbs

Affiliations

Clustering of tissue-specific sub-TADs accompanies the regulation of HoxA genes in developing limbs

Soizik Berlivet et al. PLoS Genet. 2013.

Abstract

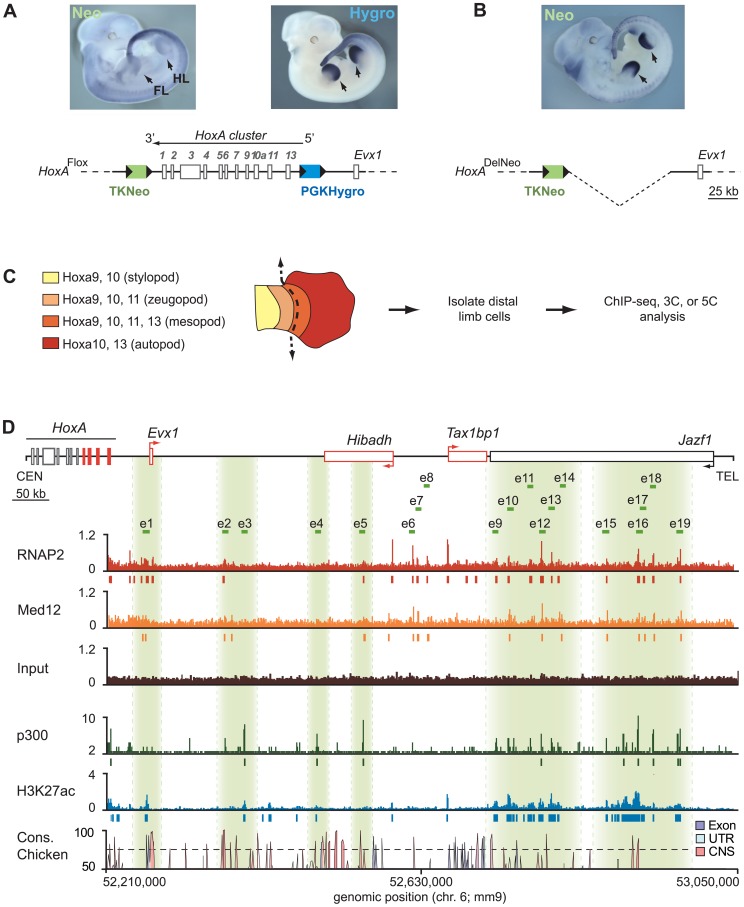
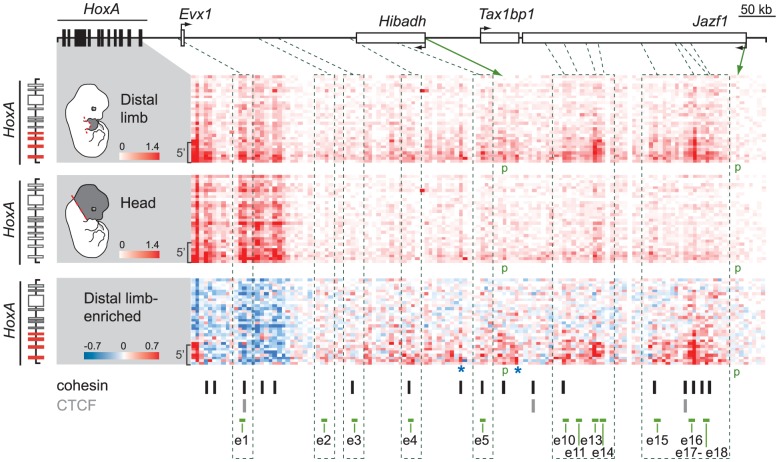
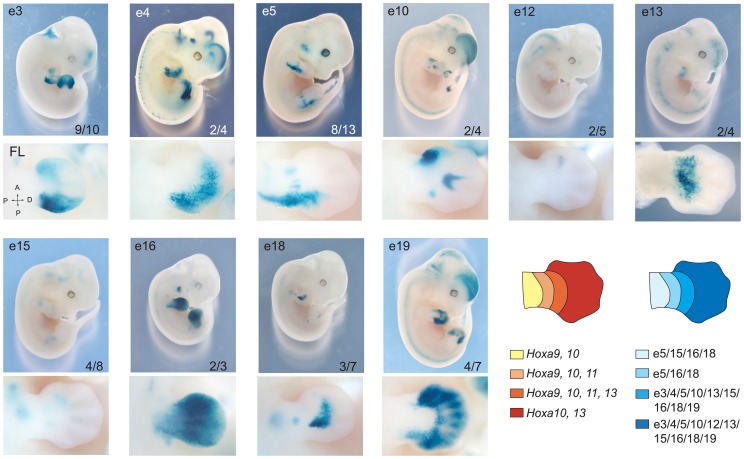
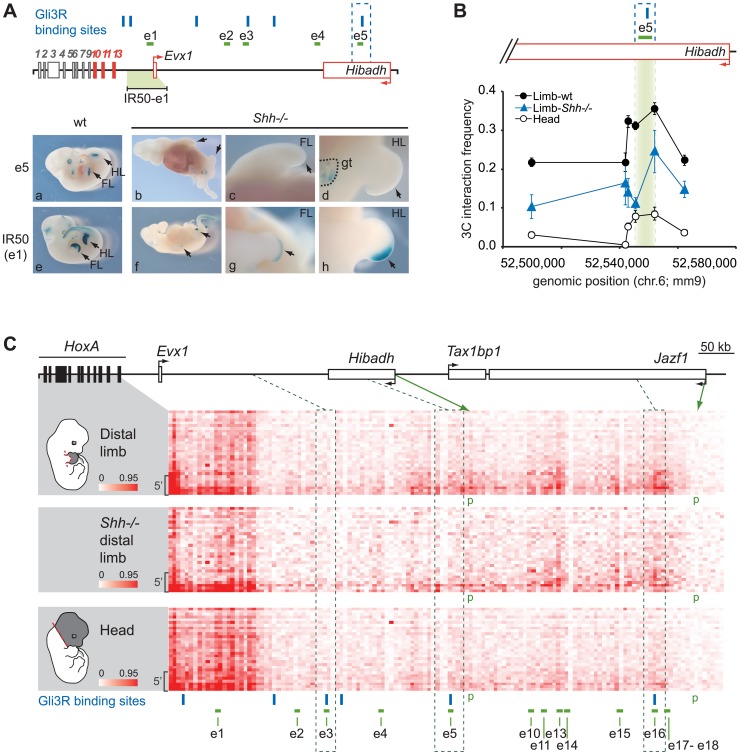
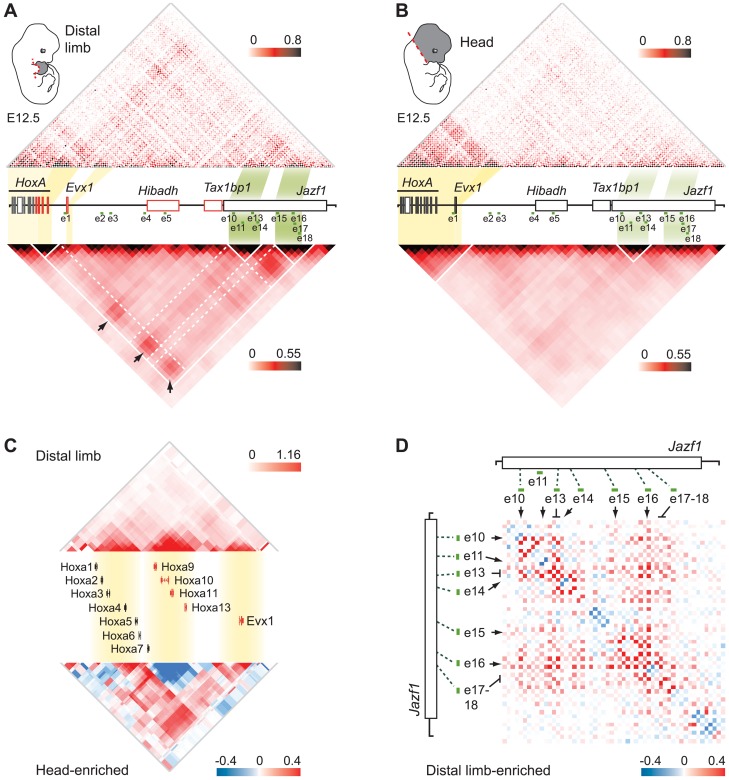
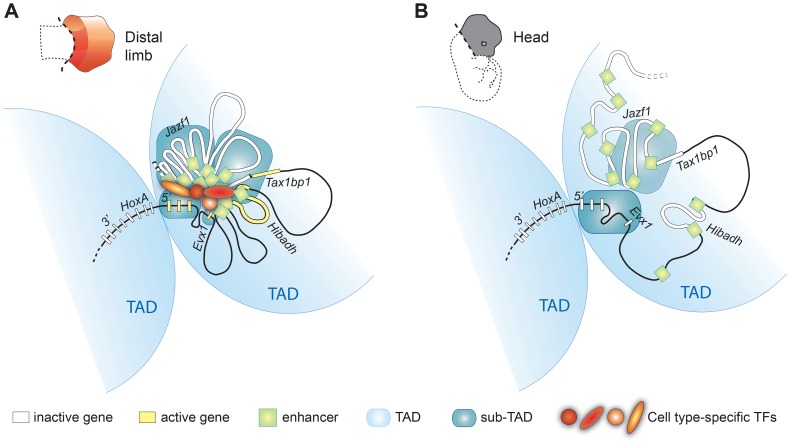
HoxA genes exhibit central roles during development and causal mutations have been found in several human syndromes including limb malformation. Despite their importance, information on how these genes are regulated is lacking. Here, we report on the first identification of bona fide transcriptional enhancers controlling HoxA genes in developing limbs and show that these enhancers are grouped into distinct topological domains at the sub-megabase scale (sub-TADs). We provide evidence that target genes and regulatory elements physically interact with each other through contacts between sub-TADs rather than by the formation of discreet "DNA loops". Interestingly, there is no obvious relationship between the functional domains of the enhancers within the limb and how they are partitioned among the topological domains, suggesting that sub-TAD formation does not rely on enhancer activity. Moreover, we show that suppressing the transcriptional activity of enhancers does not abrogate their contacts with HoxA genes. Based on these data, we propose a model whereby chromatin architecture defines the functional landscapes of enhancers. From an evolutionary standpoint, our data points to the convergent evolution of HoxA and HoxD regulation in the fin-to-limb transition, one of the major morphological innovations in vertebrates.


Conflict of interest statement

The authors have declared that no competing interests exist.

Figures

Figure 1
Figure 1. Candidate limb enhancers reside on the telomeric side of the HoxA cluster.
A, B. Distal limb enhancer activity lies upstream of the HoxA cluster and does not require sequences within it. Expression of the Neomycin and Hygromycin reporter genes flanking the cluster were analyzed by whole mount in situ hybridization on E11.5 embryos. In embryos where the HoxA cluster is intact (A), expression of the upstream Hygromycin reporter was detected in the distal part of the limb while downstream neomycin transcripts were not. TKNeo: minimal thymidine kinase promoter upstream of Neomycin reporter gene. PGKHygro: minimal phosphoglycerate kinase-1 promoter upstream of Hygromycin reporter gene. Arrow above the HoxA cluster diagram shows transcription direction. B. Neomycin expression after deletion of the cluster and PGKHygro by recombination of loxP sites flanking the reporter genes shows that sequences within the cluster are not required for distal limb enhancer activity. C. Distal limb cells analyzed in this study express 5′ HoxA genes (Hoxa9 to a13). HoxA gene expression in developing limbs is illustrated on the left. The dotted line indicates the area micro-dissected to collect distal limb cells for analysis. Stylopod: upper arm, zeugopod: lower arm, mesopod: wrist, autopod: hand. D. The position of candidate enhancer sequences was identified by ChIP-seq. Proteins known as being enriched at active enhancers (RNAP2, Med12, p300) and the H3K27Ac histone mark was examined as described in Materials and Methods. The y-axis corresponds to “reads per million” except for the p300 data where the number of sequence reads is shown. Colored rectangles below each track indicate the position of significant peaks. The position of candidate enhancers (e1 to e19) is highlighted in green below the genomic region characterized, where transcriptionally active genes are in red and arrows indicate transcription direction. Sequence conservation in the chicken is shown on the bottom.
Figure 2
Figure 2. Several candidate enhancers interact specifically with 5′ HoxA genes in the limb.
Physical contacts between the HoxA cluster and the upstream genomic region containing candidate enhancers were measured by 5C-seq in distal limb (top) and the head (middle) of E12.5 embryos. 5C data is represented in heatmap form with the color intensity of each pixel reflecting the frequency of interaction between two genomic regions. Contact frequency is according to the respective color scales and corresponds to the number of sequence reads. Most predicted enhancers (4;5;10;11;13;14;15;16;17;18) interacted long-distance specifically with 5′ HoxA genes and these interactions were enriched in the limb (bottom panel). Color scale in the bottom panel contrasts interactions enriched in the limb (red) and in the head (blue). Green dotted lines link the position of enhancers along the genomic region to the corresponding 5C fragments. Brackets on the left hand side of each heatmap show the area containing Hoxa9, a10, a11, and a13. Green arrows point to the chromatin fragments containing the Hibadh and Jazf1 promoters (p). Blue stars highlight other limb-enriched interactions with HoxA genes that do not correspond to candidate enhancers. Restriction fragments corresponding to enhancer e6–8, 12, and 19 could not be included in the 5C design as they fell into regions that were not amenable to 5C (see Materials and Methods). Loci bound by cohesin (black bars) and/or CTCF (grey bars) in limb bud cells at E11.5 are indicated below the 5C heatmaps. Note that most interactions identified by 5C correspond to loci bound by cohesin.
Figure 3
Figure 3. Overlapping domain-specific enhancer activity regulates 5′ HoxA genes in distal limbs.
Transgenic analysis of enhancer candidates. In each row, top panels show LacZ staining in whole embryos and higher magnification of the limb bud is shown below. Tested enhancers are indicated at the top of each panel, and the number at the bottom represents embryos positive for the pattern reported over the total number of transgenic specimens analyzed. Lower panels present a dorsal view of corresponding forelimbs (FL) except for e13, which is shown ventrally. Diagrams on the right summarize the expression patterns of HoxA genes (left), and the activity of each enhancer (right) in the developing limb at E12.5, respectively.
Figure 4
Figure 4. Regulatory HoxA contacts are independent of enhancer activity.
A. Analysis of e1 and e5 activity in Shh−/− limbs. Upper panel: Scheme representing loci bound by Gli3R (blue bars) along the HoxA regulatory region. The IR50 transgene used as control contains the 50 kb intergenic region to Hoxa13 and Evx1, which includes e1. Active genes are shown in red, and arrows indicate the position of promoters and transcription direction. Lower panel: LacZ staining showing e5 (a–d) and e1 (e–h) transcriptional activity, in wt (a; e) and Shh−/− embryos (b–d; f–h). B. Long-range e5 interaction with Hoxa13 is independent of its activity. The physical proximity between the Hoxa13 gene and e5 was measured by 3C. The position of e5 is highlighted in green. Interaction frequency were measured compared to a BAC 3C library as described in the Materials and Methods. Error bars correspond to the standard error of the mean. C. Physical contacts between the HoxA cluster and the upstream genomic region measured by 5C-seq in wild-type distal limb (top), Shh−/− mutant distal limb (middle), and the head (bottom) of mouse embryos. 5C data is presented in the form of heatmaps according to color scales as described in Figure 2. The limb-specific interaction pattern between enhancers and the 5′ HoxA genes are similar in Shh−/− (middle panel) and wt distal limb buds (top panel) albeit with some interaction frequencies slightly reduced. Dotted lines delineate the regions containing the enhancers bound by Gli3R (e3, e5 and e16). Gli3R sites are represented with blue bars. Brackets on the left hand side of each heatmap show the area containing Hoxa9, a10, a11, and a13. Green arrows indicate the chromatin fragments containing the Hibadh and Jazf1 promoters (p). Restriction fragments corresponding to enhancer e6–8, 12, and 19 are not shown in the heatmaps as they fell into regions that were not amenable to 5C (see Materials and Methods).
Figure 5
Figure 5. Extensive clustering of genes and enhancers highlights a complex regulation network in distal limbs.
A,B. 5C interaction matrix of the HoxA cluster and its upstream regulatory region in distal limb (A) and head (B). The 5C data was generated by 5C-seq using tissues from E12.5 embryos, and is presented in the form of heatmaps according to color scales as described in Figure 2. Heatmaps above the linear diagram of the genomic region show interaction frequencies for each restriction fragment, irrespective of their size. Heatmaps at the bottom show the mean interaction frequencies per 20 kb DNA fragment and were obtained from binning and smoothing of the 5C raw data. Expressed genes within the region are colored in red. The yellow and green shading links the genomic position of HoxA and Evx1 genes, and the enhancer clusters to the corresponding areas in heatmaps. Black arrows point to interactions between the gene sub-TADs and enhancer sub-TADs. White lines delineate the TAD and sub-TADs therein. Dashed white lines are drawn to highlight the sub-TAD interactions. C. Topological organization of the HoxA cluster and Evx1. Genes are organized in three sub-TADs in the limb (top). Interaction enrichment in head tissues compared to the limb (bottom) shows significant increase in interaction between the gene sub-TADs in the head. Smoothing was performed based on distance (8 kb) and heatmap intensities represent the mean of interaction frequency for each 8 kb window. D. Extensive limb-enriched interactions between distal HoxA enhancers suggest that a physical network regulates 5′ HoxA genes in the limb. The interaction matrix of the region containing enhancer e10 to e18 is shown in the form of a heatmap. Limb-enriched contacts are shown in red according to the color scale as described in Figure 2.
Figure 6
Figure 6. Model illustrating how genome topology underlies the tissue-specific regulation of HoxA genes.
The HoxA cluster is partitioned between two TADs (light blue), physically segregating 3′HoxA from 5′HoxA genes in a mostly cell-type independent manner. In contrast, the sub-TAD interaction pattern is drastically different in the limb (A) compared to the head (B). Limb enhancer sub-TADs (dark blue) interact with each other and with gene-sub-TADs in distal limb but not head tissue. Enhancer and gene interactions occur between sub-TADs from the same TAD (5′HoxA containing TAD) but not with 3′HoxA genes that are located in the adjacent TAD. The limb-specific sub-TAD interactions create a platform architecture controlling HoxA expression by the remote distal limb enhancers upon enhancer activation by transcription factors. The schemes of the chromatin conformation were designed assuming cellular homogeneity within each tissue.

References

    1. Kmita M, Tarchini B, Zakany J, Logan M, Tabin CJ, et al. (2005) Early developmental arrest of mammalian limbs lacking HoxA/HoxD gene function. Nature 435: 1113–1116. - PubMed
    1. Scotti M, Kmita M (2012) Recruitment of 5′ Hoxa genes in the allantois is essential for proper extra-embryonic function in placental mammals. Development 139 4: 731–9. - PMC - PubMed
    1. Medina-Martinez O, Bradley A, Ramirez-Solis R (2000) A large targeted deletion of Hoxb1-Hoxb9 produces a series of single-segment anterior homeotic transformations. Dev Biol 222: 71–83. - PubMed
    1. Spitz F, Gonzalez F, Peichel C, Vogt TF, Duboule D, et al. (2001) Large scale transgenic and cluster deletion analysis of the HoxD complex separate an ancestral regulatory module from evolutionary innovations. Genes Dev 15: 2209–2214. - PMC - PubMed
    1. Suemori H, Noguchi S (2000) Hox C cluster genes are dispensable for overall body plan of mouse embryonic development. Dev Biol 220: 333–342. - PubMed

Publication types