. 2013;9(12):e1004071.
doi: 10.1371/journal.pgen.1004071. Epub 2013 Dec 26.

Smc5/6 coordinates formation and resolution of joint molecules with chromosome morphology to ensure meiotic divisions

Affiliations

Smc5/6 coordinates formation and resolution of joint molecules with chromosome morphology to ensure meiotic divisions

Alice Copsey et al. PLoS Genet. 2013.

Abstract

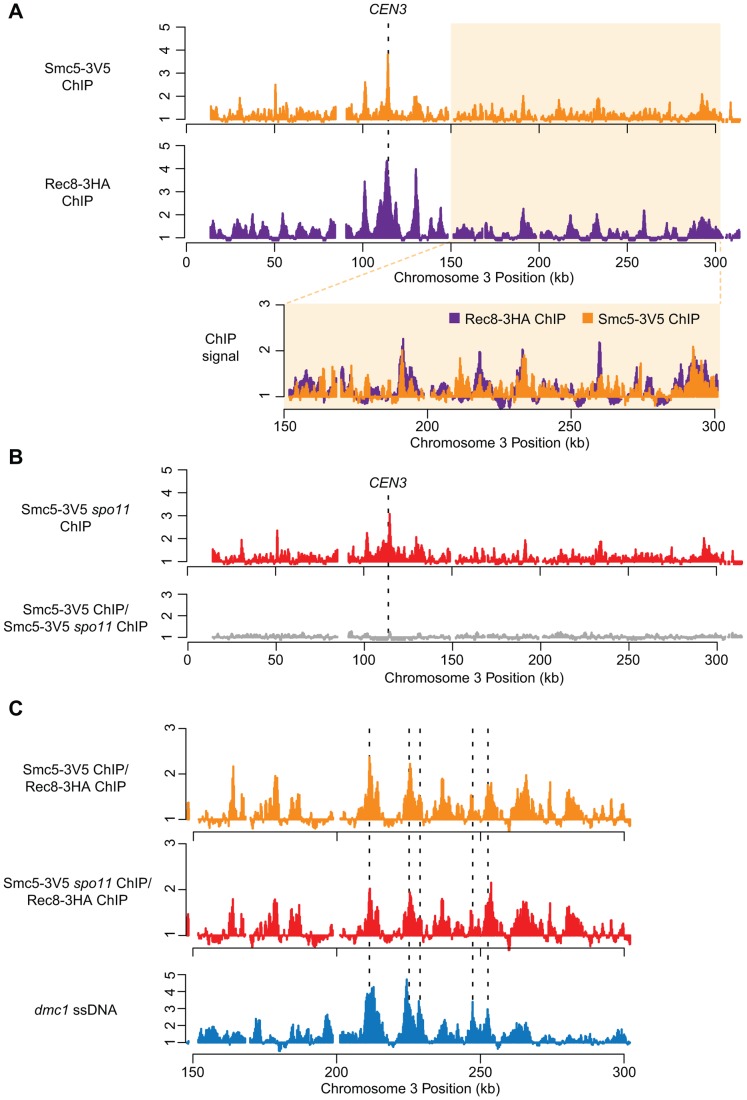
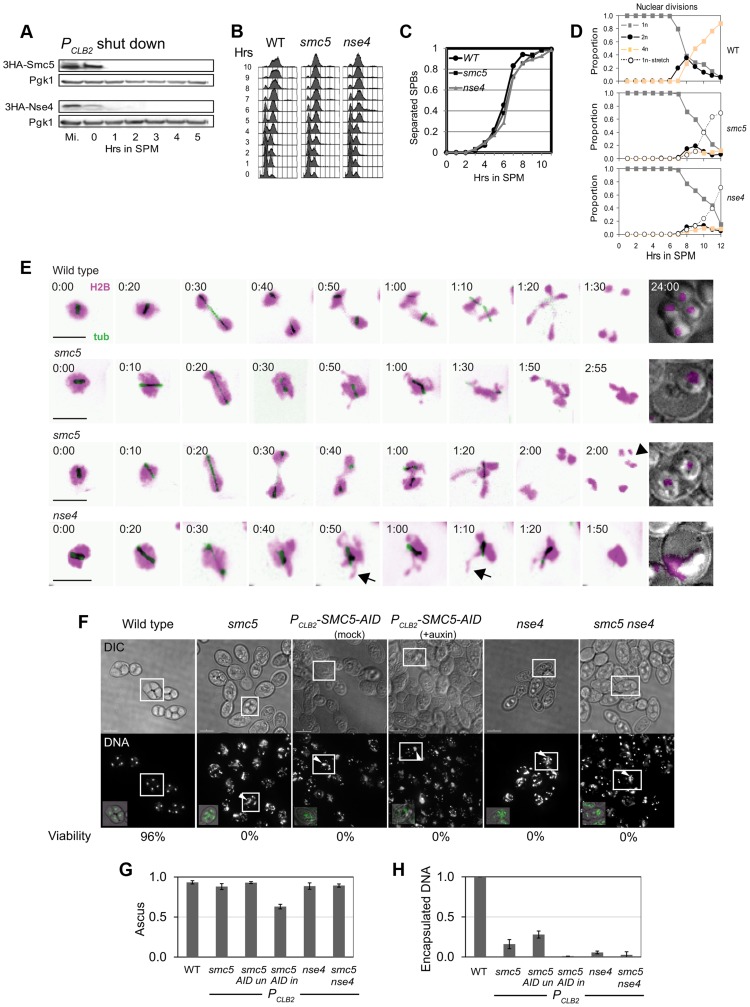
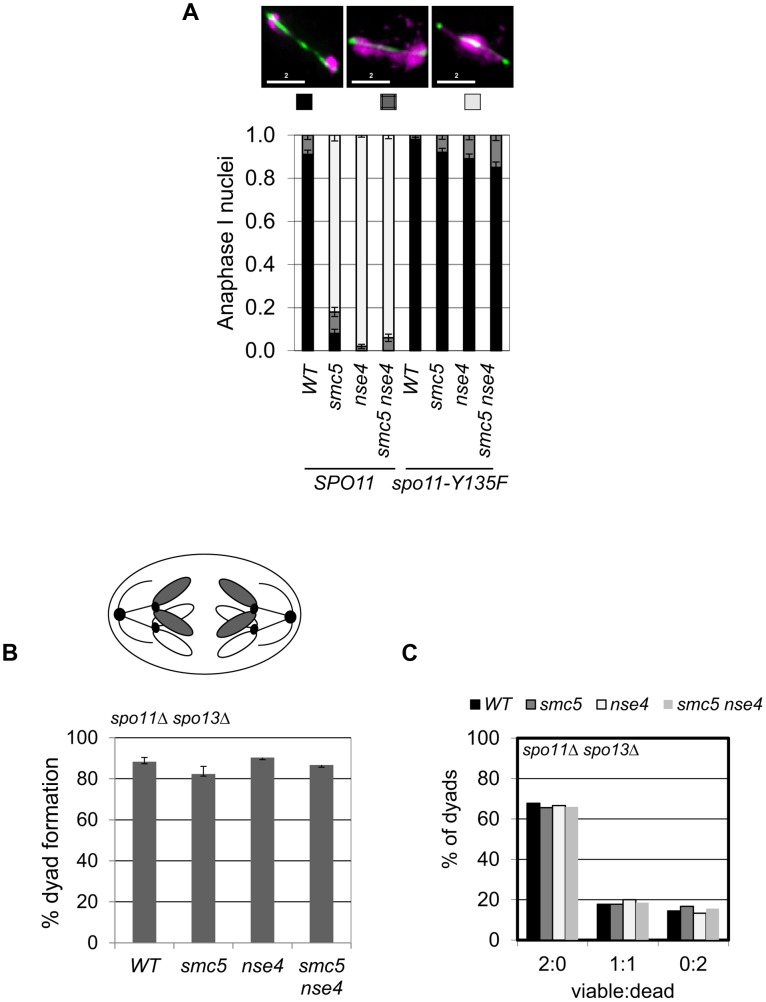
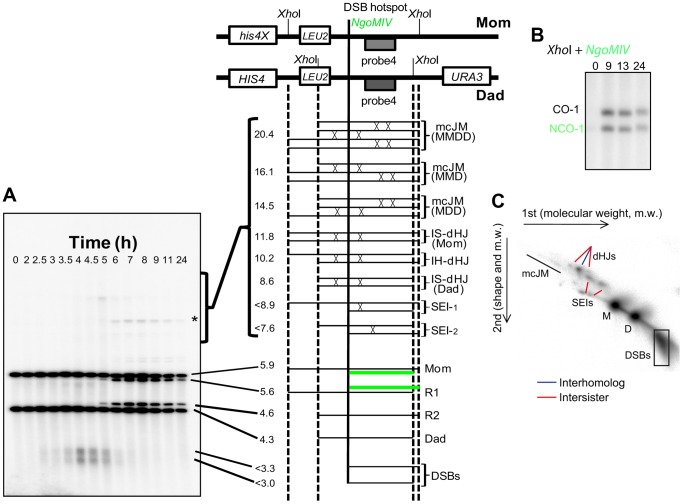
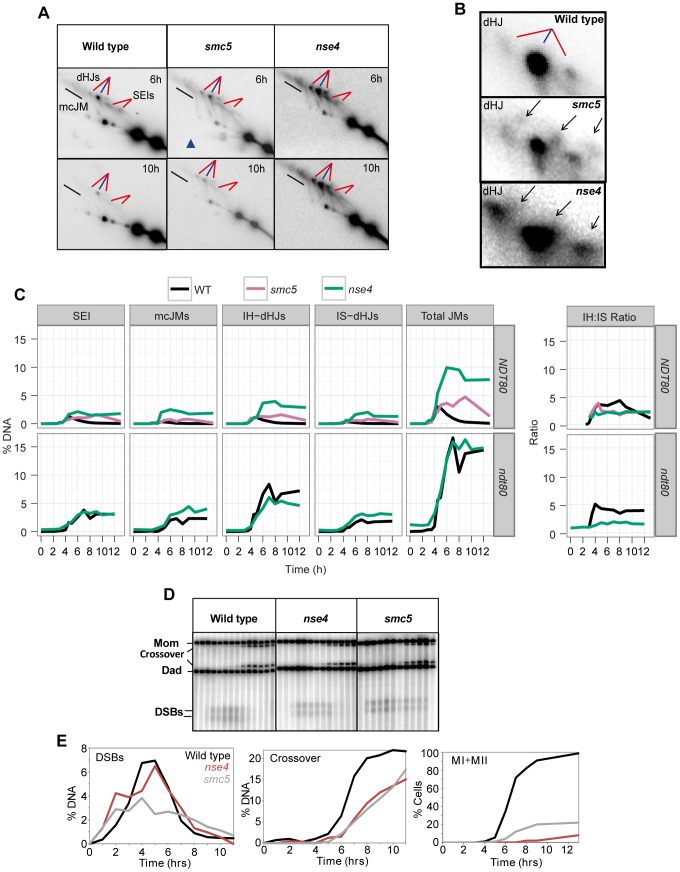
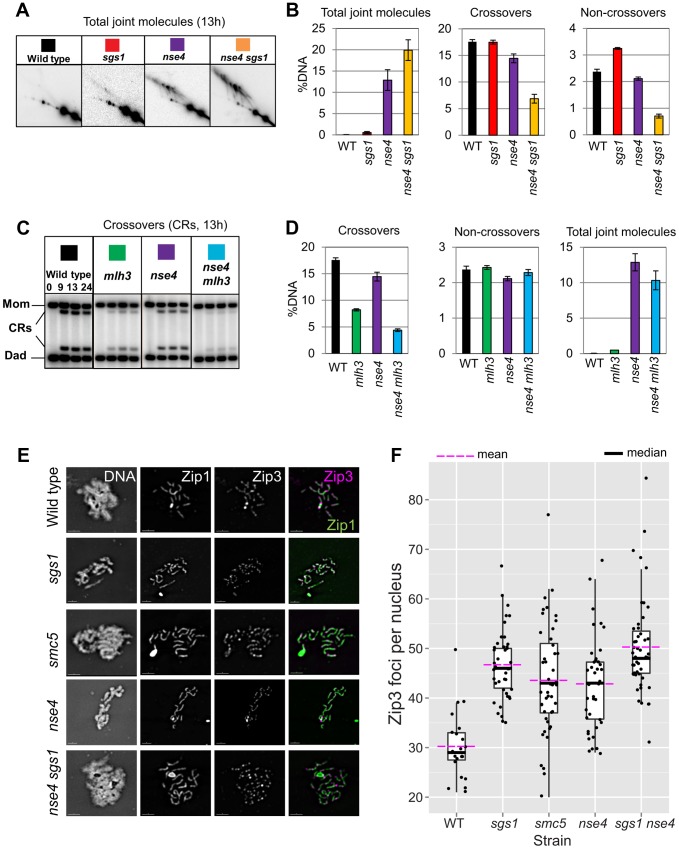
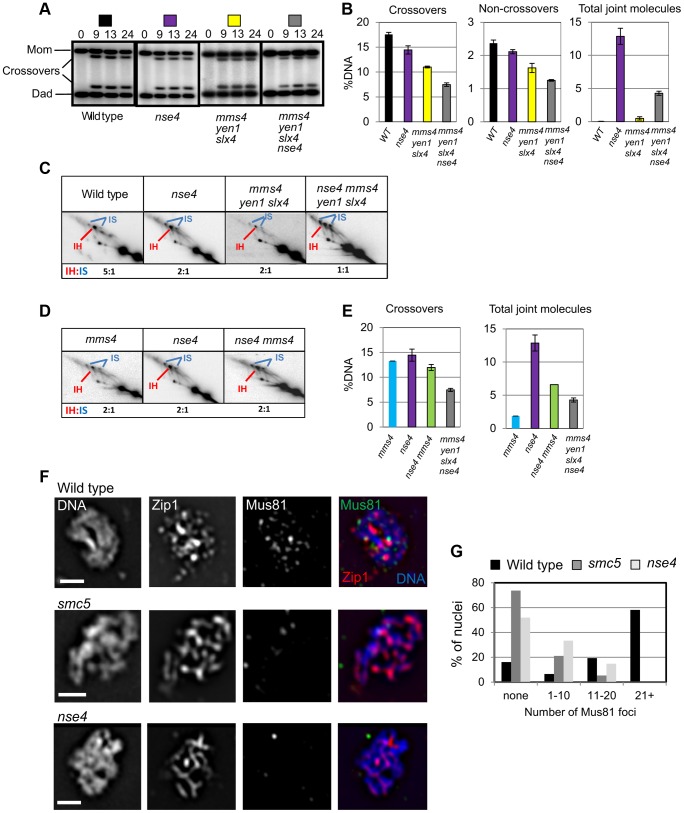
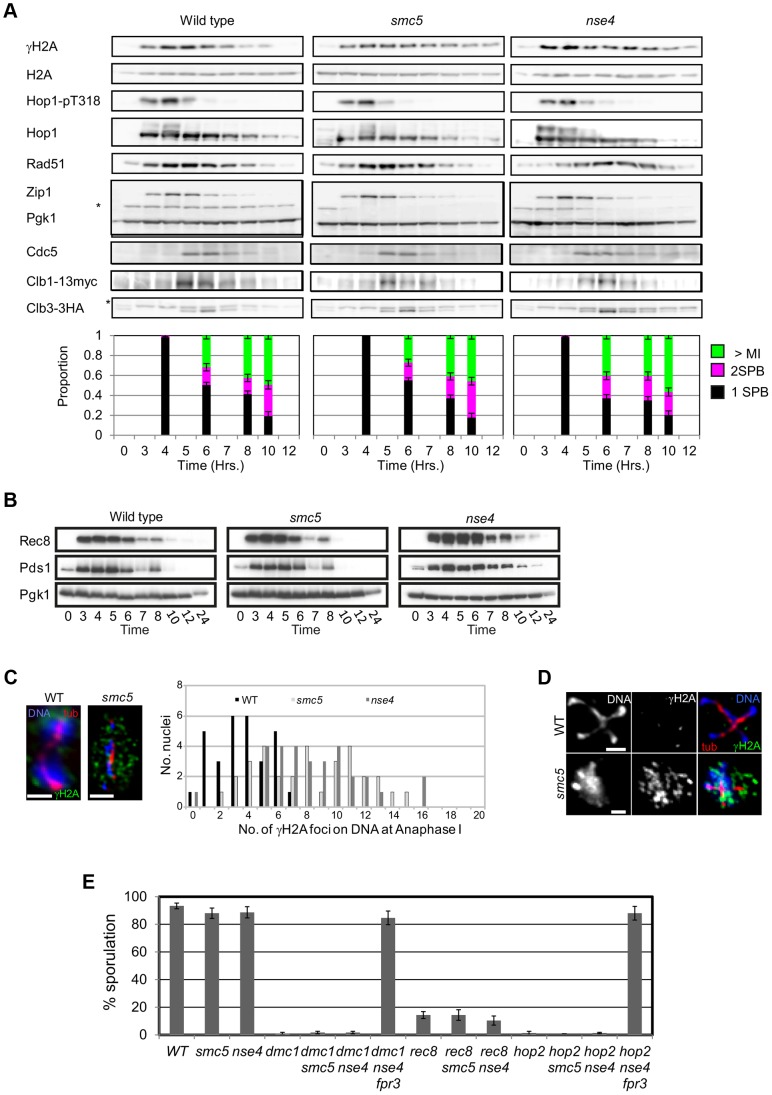
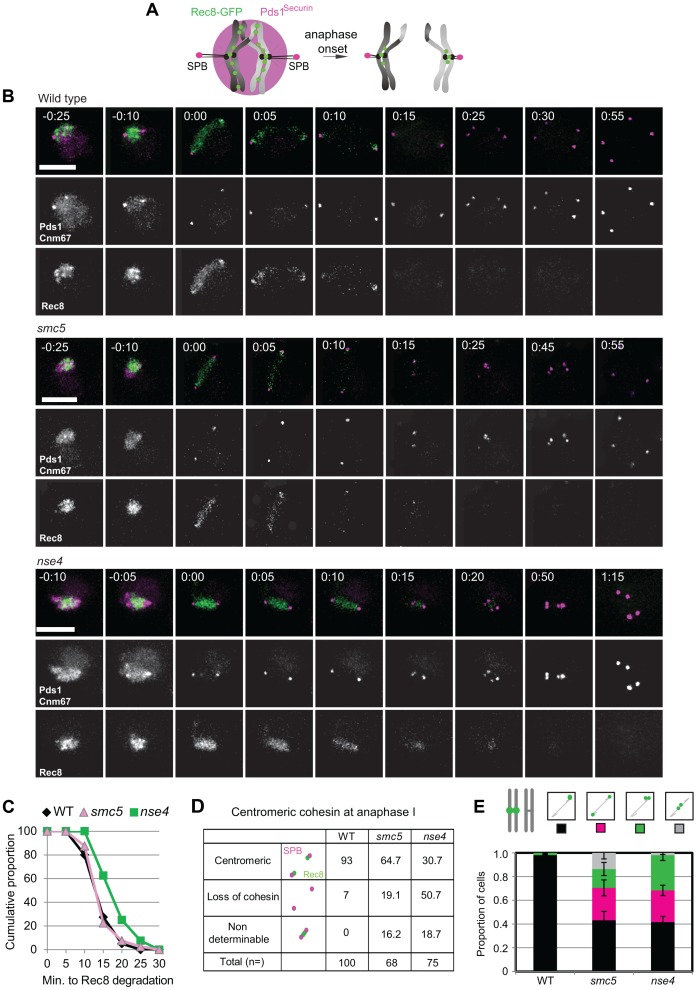
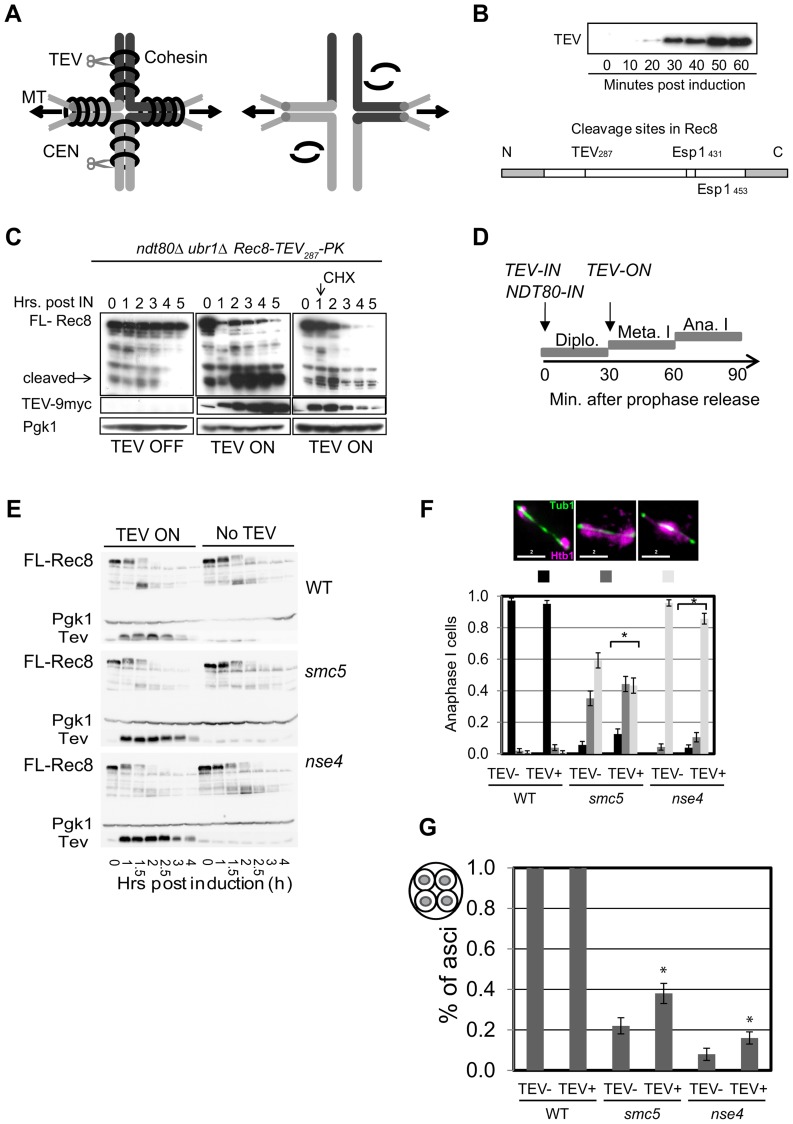
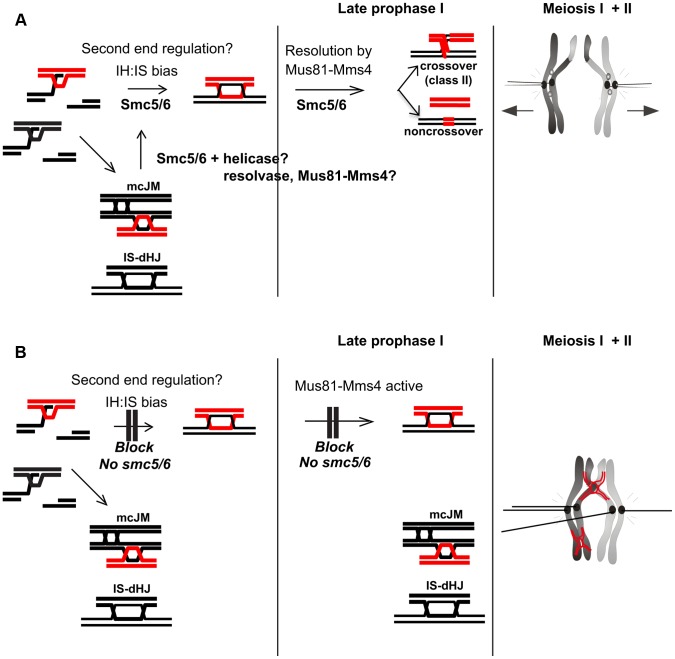
During meiosis, Structural Maintenance of Chromosome (SMC) complexes underpin two fundamental features of meiosis: homologous recombination and chromosome segregation. While meiotic functions of the cohesin and condensin complexes have been delineated, the role of the third SMC complex, Smc5/6, remains enigmatic. Here we identify specific, essential meiotic functions for the Smc5/6 complex in homologous recombination and the regulation of cohesin. We show that Smc5/6 is enriched at centromeres and cohesin-association sites where it regulates sister-chromatid cohesion and the timely removal of cohesin from chromosomal arms, respectively. Smc5/6 also localizes to recombination hotspots, where it promotes normal formation and resolution of a subset of joint-molecule intermediates. In this regard, Smc5/6 functions independently of the major crossover pathway defined by the MutLγ complex. Furthermore, we show that Smc5/6 is required for stable chromosomal localization of the XPF-family endonuclease, Mus81-Mms4(Eme1). Our data suggest that the Smc5/6 complex is required for specific recombination and chromosomal processes throughout meiosis and that in its absence, attempts at cell division with unresolved joint molecules and residual cohesin lead to severe recombination-induced meiotic catastrophe.


Conflict of interest statement

The authors have declared that no competing interests exist.

Figures

Figure 1
Figure 1. Smc5 associates with cohesin binding sites, centromeres, and DSBs.
(A) DNA binding profiles for Smc5-3V5 (orange, H6671) and Rec8-3HA (purple, H4471, [65]) plotted for Chromosome III. Lower panel shows overlay of the right arm (150–300 kb) of Chromosome III. (B) DNA binding profiles for Smc5-3V5 in a spo11Δ strain (top panel, H6674) and the normalized DNA binding of Smc5-3V5 in spo11Δ strain versus Smc5-3V5 in the SPO11 strain from (A) on Chromosome III. (C) The binding profile of Smc5-3V5 (orange) was normalized to Rec8-3HA binding using the data shown in (A) to reveal weaker, non-core binding regions. DSB sites mapped by ssDNA enrichment in the dmc1Δ mutant are indicated below (blue, H118, [100]). All ChIP experiments were carried out at 3 hours after transfer to SPM. Spindles reached their max. peak at 4 hours.
Figure 2
Figure 2. Meiotic depletion of Smc5 or Nse4 leads to meiotic catastrophe.
(A) Western blot of depletion of 3HA-Smc5 (Y941) and 3HA-Nse4 (Y942) protein levels under the PCLB2 promoter. Mutants are referred to as smc5 and nse4 throughout. (B) FACS analysis of S-phase progression in wild type (Y940), smc5 (Y941) and nse4 (Y942) mutants. (C) Population kinetics of spindle pole body separation (n = 200 per time point). (D) Population kinetics of nuclear divisions (n = 200 per time point). (E) Montage of time series of nuclear divisions and spindle dynamics from representative time-lapse movies. H2B-mCherry and Tub1-GFP are pseudo-coloured in magenta and green, respectively. Maximum projections are shown. Bars: 4 µm. Full movies are available as Supplemental Movies S1 to S4. Arrows indicate examples of nuclear spikes and arrowheads show fragmentation/micronuclei. Strains: WT (Y3606), smc5 (Y3627), nse4 (Y3630). (F) DNA encapsulation failure in smc5 and nse4 mutants. Upper panel DIC, lower panel, DAPI (DNA). The boxed asci are shown with DNA (green) overlaid in the insets in the lower panel, bottom left. Note that the samples are taken from different time points in the various strains. Bars, 5 µm. (G) Proportion of cells completing meiosis and forming an ascus (di-tyrosine fluorescence). (H) Proportion of asci with encapsulated DNA (bottom). All data were collected after 24 hours in liquid sporulation medium. Three independent diploids were assessed for each genotype (standard deviations are shown). Strains: WT (Y1381), smc5 (Y2705), PCLB2-SMC5-AID (Y3252), nse4 (Y2704), smc5 nse4 (Y3185).
Figure 3
Figure 3. Meiotic depletion of Smc5 and Nse4 leads to Spo11-dependent nuclear separation defects in meiosis.
(A) Catalytic-dead Spo11 mutation rescues nuclear separation at anaphase I in the Smc5/6 mutants (n≥100). Bars indicate standard error bars for a proportion. Strains: WT (Y1381), smc5 (Y2705), nse4 (Y2704), smc5 nse4 (Y3185), spo11-Y135F (Y3147), spo11-Y135F smc5 (Y3150), spo11-Y135F nse4 (Y3153), spo11-Y135F smc5 nse4 (Y4202). (B and C) Schematic of sister chromatid segregation at meiosis I in spo11Δ spo13Δ mutants. Dyad formation and viability after 24 hours in sporulation medium of Smc5/6 mutants in conjunction with the spo11Δ spo13Δ bypass. Strains: spo11Δ spo13Δ (Y2816), spo11Δ spo13Δ smc5 (Y2846), and spo11Δ spo13Δ nse4 (Y2848).
Figure 4
Figure 4. Assessment of meiotic recombination at the HIS4LEU2 hotspot.
(A–C) The HIS4LEU2 hotspot. mcJM: multichromatid joint molecules (abbreviations: M-Mom, D-Dad), IS-dHJ intersister double Holliday Junctions, IH-dHJ interhomolog double Holliday Junctions, SEI- single-end invasions, DSBs- double strand breaks. Digesting with XhoI gives diagnostic band sizes from parental molecules, Mom and Dad, as well as recombinant fragment lengths (R1 and R2). These are predominantly crossovers. The different molecules can be separated on 1D (A) and shape-dependent separation on 2D gels (C). Further digestion with NgoMIV differentiates noncrossovers from parental molecules (B). The * indicates a non-specific signal.
Figure 5
Figure 5. Aberrant joint molecules accumulate in smc5 and nse4 mutants.
(A) Examples of time courses from 2D gels. Blue lines point at joint molecules formed between homologous chromosomes (interhomolog, IH) and red lines indicate joint molecules composed of sister chromatids (intersister, IS). Strains: WT (Y2976), smc5 (Y1211), nse4 (Y1212). (B) Enlarged dHJ spots from wild type, smc5, and nse4. (C) Smoothed levels of single end invasions (SEIs), multichromatid joint molecules (mcJMs), interhomolog-double Holliday Junctions (IH-dHJs), intersister-double Holliday Junctions (IS-dHJs), IH-dHJ to IS-dHJ (IH∶IS) ratio, and total joint molecules (Total JMs). Cumulative levels of recombination were assessed in the ndt80Δ background (lower panel). Strains: ndt80 (Y3025), ndt80 nse4 (Y3843). (D) Examples of time course analyses of double-strand break and crossover formation. (E) Quantification of DSB, crossover, MI+MII nuclear divisions.
Figure 6
Figure 6. Sgs1 and MutLγ are functional in smc5/6.
(A) Representative images of 2D analysis from sgs1 mutant (PCLB2-3HA-SGS1) in combination with nse4. (B) Quantification of total joint molecules, crossovers and non-crossovers, and total joint molecule levels at meiotic endpoints (13 hours). Quantification from three independent diploids; error bars represent the standard deviation. (C) Representative images of crossover formation in mlh3Δ mutants, in combination with nse4. (D) Quantification of crossovers, noncrossovers, and total joint molecules levels from three independent diploids (13 hours). (E,F) Analysis of Zip3 foci. Representative images and Tukey-Kramer box-and-whisker plot of 30 nuclei from each strain (boxes represent the 25th–75th percentile; the median value is denoted by the horizontal bar, and the whiskers are 1.5× the 25–75th percentile or max or min. values- whichever are the lowest). Fold increase in Zip3-GFP foci relative to wild type was calculated based on the arithmetic mean (horizontal bar, magenta). Note that the Zip3-GFP causes some polycomplex formation of Zip1 predominantly in the mutants but also in the wild type. The distributions of all four mutant strains were significantly different from wild type (p<0.01, Kruskall-Wallace). Strains: WT (Y1435), sgs1 (Y3591), smc5 (Y3514), nse4 (Y3511), sgs1 nse4 (Y3636).
Figure 7
Figure 7. Smc5/6 regulates joint molecule resolution by Mus81-Mms4.
(A) Representative images of 1D analysis of crossover levels. (B) Quantification of crossovers, non-crossovers, and total joint molecule levels at meiotic endpoints (13 hours). Quantification from three independent diploids; error bars represent the standard deviation. (C) Representative images of 2D analysis of IH∶IS ratio in nse4 and nse4 mms4 yen1 slx4 quadruple mutants in the ndt80Δ background (13 hours). Data from three independent diploids. (D) Representative images of 2D analysis of IH∶IS ratio in nse4 and nse4 mms4 mutants the ndt80Δ background (13 hours). Data from three independent diploids. (E) Quantification of crossovers and total joint molecules in nse4 mms4 mutants compared to individual single mutants and the nse4 mms4 yen1 slx4 quadruple mutant. (F,G) Representative images of Mus81 foci on spread, meiotic nuclei and quantification of Mus81-9myc foci. Nuclei were selected on the basis of linear Zip1 structures (pachynema). 100 nuclei were assessed for each strain. For the mms4 single strain, we ran only one diploid in parallel with the nse4 mutants. These data were similar to those described previously . Strains: WT (Y3137), smc5 (Y3135), and nse4 (Y3144).
Figure 8
Figure 8. Smc5/6-depleted cells progress relatively normally through meiotic prophase I and enter nuclear divisions with damaged DNA.
(A) Western blot analysis of Mec1 substrates, Hop1 (pT318) and H2A (pS129, γH2A). Clb1 and Clb3 are meiosis I- and meiosis II-specific B-type cyclins, respectively . Pgk1 is a loading control. Strains: WT (Y4567), smc5 (Y4570), and nse4 (Y4573). Spindle pole body separation was used as a marker of cell cycle progression. (B) Western blot of Rec8-GFP and Pds1-13Myc. Strains: WT (Y2572), smc5 (Y2673), and nse4 (Y3653). (C) Typical examples of immunofluorescence images of γH2A at anaphase I from wild type and the two mutants. Bars: 2 µm. Right: quantification of the number of γH2A foci directly localized to the DNA. WT (Y1381), smc5 (Y2704), and nse4 (Y2705). (D) Typical examples of immunofluorescence images from wild type and smc5 undergoing meiosis II. Bars: 2 µm. (E) Sporulation frequencies at 24 hours in smc5 and nse4 mutants in combination with mutants that show robust prophase I arrest. Strains: WT (Y1381), smc5 (Y2704), and nse4 (Y2705), dmc1 (Y2045), dmc1 smc5 (Y3491), dmc1 nse4 (Y3488), dmc1 nse4 fpr3 (Y4606), rec8 (Y4607), rec8 smc5 (Y2856), rec8 nse4 (Y2855), hop2 (Y2489), hop2 smc5 (Y4610), hop2 nse4 (Y4613), hop2 nse4 fpr3 (Y4616).
Figure 9
Figure 9. Misregulation of cohesin in smc5/6-depleted cells.
(A) Experimental set up: Spindle pole body component CNM67-mCherry and Pds1Securin-tdTomato were used to assess spindle length and the onset of anaphase I, respectively. Rec8 is tagged with GFP. Upon anaphase I onset, Pds1Securin-tdTomato is degraded, the distance between CNM67-mCherry foci increase, and Rec8-GFP is degraded along arm regions until only centric and pericentromeric cohesin is left (right hand diagram). (B) Typical examples of time lapse images from wild type and the two mutants. Bars: 4 µm. Arrows indicate loss of centromeric cohesin signal. Note that the temporal resolution of kinetics is limited to 5 min. Strains: WT (Y2572), smc5 (Y2673), and nse4 (Y3047). Full movies are available in the Supplemental Information (Movies S5, S6, S7). (C) The cumulative proportion of cells with arm cohesin has been degraded at the given time after anaphase I onset (n≥40 per strain). Significance tests for Kruskall-Wallis (P<0.01) show nse4 is delayed compared to wild type and smc5. (D) Proportions of nuclei with centromeric cohesin at anaphase I from live-cell imaging experiments. Anaphase I was staged by loss of Pds1 signal. (E) Analysis of sister kinetochore separation. tetO repeats are inserted 1.5 kb from CEN5 and tetR-GFP expressed constitutively. Only one homolog contains the tetO-CEN5 insertions, which allows analysis of sister kinetochore behaviour. Bars represent standard error (n>100 for each strain). Anaphase I was staged by spindles being greater than 4 µm in length. At this length, all spindles from smc5 and nse4 were Pds1 negative (data not shown). WT (Y2708), smc5 (Y2709), and nse4 (Y3071).
Figure 10
Figure 10. Retained arm cohesin at anaphase I contributes to the chromosome resolution defect in the smc5 and nse4 mutants.
(A) Diagram of bivalent resolution by cohesin (Rec8) cleavage along arms regions Abbreviations: MT-microtubules, CEN-centromeres, scissors depict TEV protease. (B) TEV-9Myc expression after induction during a meiotic time course and the TEV cleavage site introduced into Rec8. Note that Rec8-TEV287-PK retains its two separase (Esp1) cleavage sites. (C) Rec8-TEV287-PK cleavage by TEV protease in ndt80Δ ubr1Δ cells. TEV protease was induced 6 hours into meiosis when >80% are arrested in pachynema. FL-full length Rec8-TEV287-PK. Left panel shows no TEV induction; the middle panels shows TEV induction; and the right panel shows TEV induction and cyclohexamide treatment (CHX) 1.15 hours after induction. Pgk1 was used as a loading control. Strain: Y3380. (D) Experimental set up of TEV protease induction after meiotic prophase by simultaneous induction of TEV protease and prophase exit (NDT80-IN). (E) Analysis of protein levels of Rec8-TEV287-PK in arrested and released (NDT80-IN) cells. (F) Nuclear separation at anaphase I. Bar graph shows proportion of tetrads with fully separated, ‘stretched’ or compacted nuclear appearance. The *denotes statistically significant differences (p<0.01, G-test) in the distribution of classes. (G) DNA encapsulation into spores. Bar graph shows proportion of tetrads with fully encapsulated DNA. The *denotes statistically significant differences (p<0.05, G-test) in the distribution of classes. Strains: WT (Y3264- no TEV and Y3299), smc5 (Y3261- no TEV and Y3237), and nse4 (Y3258- no TEV and Y3240).
Figure 11
Figure 11. Model for Smc5/6 function during meiosis.
(A) In wild type cells, Smc5/6 is present and ensures the formation of IH-dHJs either directly or perhaps by removing mcJMs and IS-dHJs, returning them to an interhomolog fate. This could be done in co-operation with helicases and resolvases, potentially Mus81-Mms4. (B) In the absence of Smc5/6, second end regulation is aberrant and cells enter late prophase with increased mcJMs and IS-dHJs. These are not cleaved by Mus81-Mms4, which is hyperphosphorylated by Cdc5, because it requires Smc5/6. Since the joint molecules do not appear to trigger a prophase I checkpoint, smc5/6 mutants enter the nuclear divisions with joint molecules as well as precociously separated sister kinetochores that prevent chromosome segregation, leading to meiotic catastrophe.

References

    1. Neale MJ, Keeney S (2006) Clarifying the mechanics of DNA strand exchange in meiotic recombination. Nature 442: 153–158. - PMC - PubMed
    1. Henderson KA, Keeney S (2004) Tying synaptonemal complex initiation to the formation and programmed repair of DNA double-strand breaks. Proc Natl Acad Sci U S A 101: 4519–4524. - PMC - PubMed
    1. Kitajima TS, Kawashima SA, Watanabe Y (2004) The conserved kinetochore protein shugoshin protects centromeric cohesion during meiosis. Nature 427: 510–517. - PubMed
    1. Marston AL, Tham WH, Shah H, Amon A (2004) A genome-wide screen identifies genes required for centromeric cohesion. Science 303: 1367–1370. - PubMed
    1. Gregan J, Rabitsch PK, Sakem B, Csutak O, Latypov V, et al. (2005) Novel genes required for meiotic chromosome segregation are identified by a high-throughput knockout screen in fission yeast. Curr Biol 15: 1663–1669. - PubMed

Publication types

MeSH terms