. 2013 Dec 27;8(12):e82444.
doi: 10.1371/journal.pone.0082444. eCollection 2013.

The development of a novel high throughput computational tool for studying individual and collective cellular migration

Affiliations

The development of a novel high throughput computational tool for studying individual and collective cellular migration

Douglas A Chapnick et al. PLoS One. .

Abstract

Understanding how cells migrate individually and collectively during development and cancer metastasis can be significantly aided by a computation tool to accurately measure not only cellular migration speed, but also migration direction and changes in migration direction in a temporal and spatial manner. We have developed such a tool for cell migration researchers, named Pathfinder, which is capable of simultaneously measuring the migration speed, migration direction, and changes in migration directions of thousands of cells both instantaneously and over long periods of time from fluorescence microscopy data. Additionally, we demonstrate how the Pathfinder software can be used to quantify collective cell migration. The novel capability of the Pathfinder software to measure the changes in migration direction of large populations of cells in a spatiotemporal manner will aid cellular migration research by providing a robust method for determining the mechanisms of cellular guidance during individual and collective cell migration.


Conflict of interest statement

Competing Interests: The authors have declared that no competing interests exist.

Figures

Figure 1
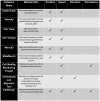
Figure 1. The Pathfinder cell motility program uniquely incorporates measurements of cellular position, speed, direction, and persistence.
Although several cellular motility programs are available to measure cellular motility in terms of position and speed, only the Pathfinder program additionally reports both cellular migration direction and cellular migration persistence.
Figure 2
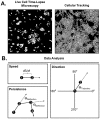
Figure 2. Angular measurements of cellular migration can reveal cellular behavior.
A) The Pathfinder program converts time-lapse microscopy videos of fluorescent HaCaT cells (left) to cellular tracks (right). B) The Pathfinder program uses the positional information of cellular tracks to calculate speed, where dS represents change in position and dt represents change in time (top), migration persistence through the absolute angle of deflection (bottom), and the migration direction relative to a well-defined axis orientation in the field of view (right).
Figure 3
Figure 3. Average absolute angle of deflection measurements accurately depict the migration persistence of cells.
A) Cells do not prefer to turn right or left in either the presence (right) or absence (left) of EGF stimulation. A binned histogram of percent of cells versus percent of right turns is normal and centered around 50 percent. B) A comparison of persistence time calculations and average absolute angle of deflection (formula image) methods for measuring migration persistence yields identical trends in both the presence and absence of either TGFβ or EGF for MDA-MB-231 cells and HaCaT cells. Double asterisks indicate a p value<0.01. Each condition represents greater than 200 cells for persistence time measurements, and greater than 1000 cells for average absolute angle of deflection measurements.
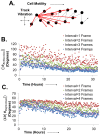
Figure 4
Figure 4. Overlapping Intervals Suppress Angular Noise in Cellular Migration.
A) A schematic representation of a cellular track illustrates how increasing interval size results in the calculation of a cellular migration direction that is resistant to track vibration noise. B) The average absolute angle of deflection as a function of time for TGFβ treated HaCaT H2B mCherry cells for an interval size of one frame shows strong scattering of measurements. Upon increasing interval size, such scattering is suppressed. C) Such scattering can be also measured by measuring the standard deviation in the absolute angle of deflection, which can be suppressed in a similar manner by increasing interval size. Data represents greater than 1000 cells for each plot.
Figure 5
Figure 5. Measuring individual cellular behavior with speed and migration persistence reveals cell type and ligand specific cellular migration behavior.
Cellular tracks of low density cells are displayed for treatments of either Mock, TGFβ or EGF for MDA-MB-231 cells (A) or HaCaT cells (B). Calibration bars represent 150 µm. C) Neither TGF-Beta nor EGF stimulation affects migration persistence in MDA-MB-231cells (top). In contrast, both treatments affect cellular speed, but with different induction kinetics (bottom). D) In HaCaT cells, both ligand treatments affect migration persistence and cellular speed (top and bottom, respectively). However, EGF stimulates migration persistence with earlier kinetics than that of TGFβ (top), and EGF is a poor stimulator of migration speed (bottom, right). Each condition represents greater than 1000 cells.
Figure 6
Figure 6. Angular measurements can be used to quantify collective migration behavior.
A) Cellular tracks of confluent monolayers of HaCaT (top) and MDA-MB-231 cells (bottom) in the presence and absence of EGF stimulation. Calibration bar represents 150 µm. B) Confluent monolayers of HaCaT cells in the presence and absence of EGF stimulation were quantified for their collective migration behavior by calculating the average standard deviation of the angle of trajectory (also called the paired random migration index (PRMI ΘTajectory) amongst nearest neighboring cells. Random pairing was used to determine whether the observed behavior was local or global amongst the population. C) The same quantification was conducted for MDA-MB-231 cells. D) Cellular tracks of epithelial sheets of HaCaT cells in the presence and absence of EGF stimulation. Calibration bar represents 150 µm. E) Inspection of the spatial distribution of collective migration behavior reveals that EGF stimulation elicits collective migration that propagates away from the leading edge. Double asterisks indicate a p value<0.01.

References

    1. Chambers AF, Groom AC, MacDonald IC (2002) Dissemination and growth of cancer cells in metastatic sites. Nat Rev Cancer 2: 563–572. - PubMed
    1. Friedl P, Wolf K (2003) Tumour-cell invasion and migration: diversity and escape mechanisms. Nat Rev Cancer 3: 362–374. - PubMed
    1. Keller R (2005) Cell migration during gastrulation. Curr Opin Cell Biol 17: 533–541. - PubMed
    1. Locascio A, Nieto MA (2001) Cell movements during vertebrate development: integrated tissue behaviour versus individual cell migration. Curr Opin Genet Dev 11: 464–469. - PubMed
    1. Montell DJ (2003) Border-cell migration: the race is on. Nat Rev Mol Cell Biol 4: 13–24. - PubMed

Publication types

LinkOut - more resources