. 2013 Dec 26;8(12):e83719.
doi: 10.1371/journal.pone.0083719. eCollection 2013.

The glycome of normal and malignant plasma cells

Affiliations

The glycome of normal and malignant plasma cells

Thomas M Moehler et al. PLoS One. .

Abstract

The glycome, i.e. the cellular repertoire of glycan structures, contributes to important functions such as adhesion and intercellular communication. Enzymes regulating cellular glycosylation processes are related to the pathogenesis of cancer including multiple myeloma. Here we analyze the transcriptional differences in the glycome of normal (n = 10) and two cohorts of 332 and 345 malignant plasma-cell samples, association with known multiple myeloma subentities as defined by presence of chromosomal aberrations, potential therapeutic targets, and its prognostic impact. We found i) malignant vs. normal plasma cells to show a characteristic glycome-signature. They can ii) be delineated by a lasso-based predictor from normal plasma cells based on this signature. iii) Cytogenetic aberrations lead to distinct glycan-gene expression patterns for t(11;14), t(4;14), hyperdiploidy, 1q21-gain and deletion of 13q14. iv) A 38-gene glycome-signature significantly delineates patients with adverse survival in two independent cohorts of 545 patients treated with high-dose melphalan and autologous stem cell transplantation. v) As single gene, expression of the phosphatidyl-inositol-glycan protein M as part of the targetable glycosyl-phosphatidyl-inositol-anchor-biosynthesis pathway is associated with adverse survival. The prognostically relevant glycome deviation in malignant cells invites novel strategies of therapy for multiple myeloma.


Conflict of interest statement

Competing Interests: The authors have declared that no competing interests exist.

Figures

Figure 1
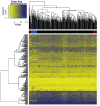
Figure 1. Unsupervised clustering of expression of glycan genes.
Heat Map and global gene expression analysis: Unsupervised hierarchical clustering of glycan gene expression. Individual patient samples are shown in columns and genes in rows. Expression is displayed in yellow color and blue color depending on expression above or below median expression level. Color intensity is dependent on the degree of deviation from median. Sample type is highlighted above the heatmap in colors: black: myeloma cells, blue: human myeloma cell lines, red: normal bone marrow plasma cells.
Figure 2
Figure 2. Gene expression of significantly regulated genes of the heparan sulfate pathway.
A–D: Four genes of the glycosaminglycan-heparan sulfate (GAG-HS) biosynthetic pathway (EXT2/EXTL2/B3GAT1/HS2ST1) are significantly upregulated in myeloma compared to normal bone marrow plasma cells. Boxplots display the median and range for these genes for myeloma patients categorized into Durie-Salmon (DS) stage I-III (MM1-3), bone marrow plasma cells from normal donors (ND), and human myeloma cell lines (HMCL). E,F: Two heparan sulfotransferases (HS6ST1 and HS3ST1) of the GAG-HS biosynthetic pathway are significantly downregulated in myeloma compared to normal plasma cells. Boxplots display the median and range for these genes for myeloma patients categorized into Durie-Salmon stage I-III (MM1-3), normal bone marrow plasma cells (ND), and human myeloma cell lines (HMCL).
Figure 3
Figure 3. Steps of heparan sulfate and GPI anchor biosynthesis.
A: Biosynthetical steps of the GAG-HS pathway and the functional role of the enzymes are shown. Green arrows indicate upregulated gene expression and red arrows downregulated gene expression. B: The steps of the GPI anchor biosynthesis are shown and the function of the proteins corresponding to the overexpressed PIG-genes M, C, B are shown.
Figure 4
Figure 4. Gene expression of significantly overexpressed genes related to the glycosylphosphatidylinositol (GPI) anchor pathway.
A–C: Median gene expression of phosphatidylinositol glycan anchor biosynthesis, class (PIG) -M, - C, B is significantly higher in malignant vs. normal bone plasma cells. Boxplots display the median and range for these genes for myeloma patients categorized into Durie-Salmon stage I-III, myeloma is compared to results in normal bone marrow plasma cells (ND), and human myeloma cell lines (HMCL). D/E: Validation of PIG-M gene expression using RT-PCR and Western Blotting using the HMCL OPM-2 with a high PIG-M expression and the HMCL KMS-12-BM with a low PIG-M expression as per gene expression profiling. D: mRNA expression of PIG-M gene was investigated using RT-PCR. E: Western Blotting was performed using standard markers tubulin and PDI, a marker for endoplasmatic reticulum, to confirm equal loading of gel and investigate the PIG-M protein of OPM-2/PIG-M expression high (left lane) and the KMS-12-BM/PIG-M expression low (right lane). F: Flow cytometric analysis of CD55 and CD56 on KMS-12-BM and OPM-2 myeloma cell lines with and without prior PLC treatment. Red lines: CD55/CD59 expression without PLC treatment, blue lines: CD55/CD59 expression after PLC-treatment, green lines: background staining solely with secondary antibody coupled to FITC.
Figure 5
Figure 5. Expression of PIGM in myeloma cells.
Immunohistochemical staining of PIGM on primary myeloma cells showing different staining patterns. A: weak, B: moderate, and C: strong.
Figure 6
Figure 6. Heat Map for genes significantly regulated comparing cytogenetically defined myeloma subentities.
A subset of glycan genes was identified by investigating significance of gene regulation for patients with the respective cytogenetic aberration compared to patients without the aberration. In a next step all identified genes (n = 148) were clustered (genes shown in rows) with the corresponding cytogenetic aberration displayed in vertical orientation (hyperdiploid (HRD), t(4;14), t(11;14), del13q14, gain of 1q21). Blue color indicates significantly downregulated genes, red color indicates significantly upregulated genes.
Figure 7
Figure 7. PIGM expression correlated to 1q21 copy number.
PIGM gene expression was plotted as log 10 and correlated with cytogenetically determined 1q21 gene copy number.
Figure 8
Figure 8. Prognostic value of glycan-gene expression score for survival.
A. Gene Score: using a LASSO classifier model a 38-gene-score (Table S5) was identified that had significant prognostic value for overall survival for our population of 332 multiple myeloma patients (A1, P = 0.002, HR1.84) and the TT2-test population (A2, P<0.0001, HR 1.58). Overall survival curves are shown according to Kaplan-Meier. B. Prognostic value of phosphatidylinositol glycan anchor biosynthesis, class M (PIG-M) gene expression for survival: Using a CoxPH model expression to investigate for glycan gene expression with significance for OS the phosphatidylinositol glycan anchor biosynthesis, class M (PIG-M) gene was found to be statistically significant for overall survival as shown for our patient population (B1, P<0.001, HR 1.28) and the test population (B2, P = 0.004, HR 1.19).

References

    1. Kyle RA, Rajkumar SV (2004) Multiple myeloma. N Engl J Med 351: 1860–1873. - PubMed
    1. Cremer FW, Bila J, Buck I, Kartal M, Hose D, et al. (2005) Delineation of distinct subgroups of multiple myeloma and a model for clonal evolution based on interphase cytogenetics. Genes Chromosomes Cancer 44: 194–203. - PubMed
    1. Fonseca R, Barlogie B, Bataille R, Bastard C, Bergsagel PL, et al. (2004) Genetics and cytogenetics of multiple myeloma: a workshop report. Cancer Res 64: 1546–1558. - PubMed
    1. Barlogie B, Tricot GJ, van Rhee F, Angtuaco E, Walker R, et al. (2006) Long-term outcome results of the first tandem autotransplant trial for multiple myeloma. Br J Haematol 135: 158–164. - PubMed
    1. Harousseau JL, Moreau P (2009) Autologous hematopoietic stem-cell transplantation for multiple myeloma. N Engl J Med 360: 2645–2654. - PubMed

Publication types