. 2013 Dec 27;8(12):e83887.
doi: 10.1371/journal.pone.0083887. eCollection 2013.

Evaluation of non-invasive multispectral imaging as a tool for measuring the effect of systemic therapy in Kaposi sarcoma

Affiliations

Evaluation of non-invasive multispectral imaging as a tool for measuring the effect of systemic therapy in Kaposi sarcoma

Jana M Kainerstorfer et al. PLoS One. .

Abstract

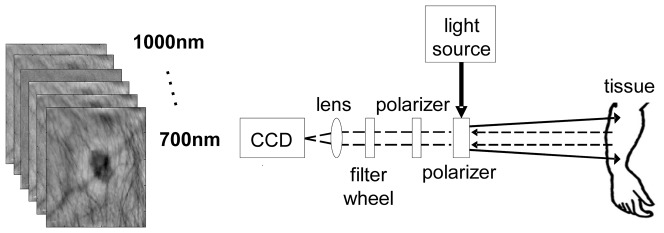
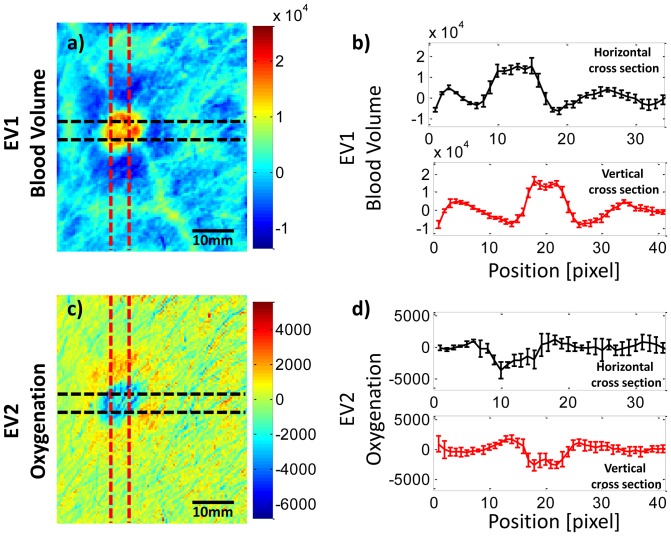
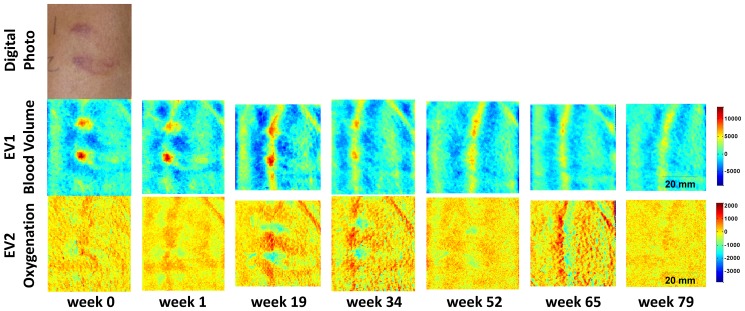
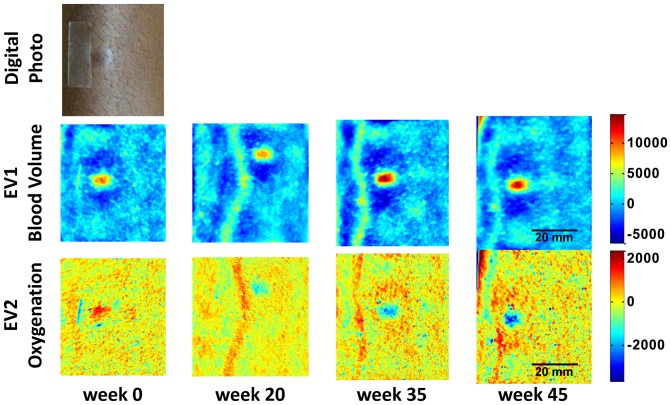
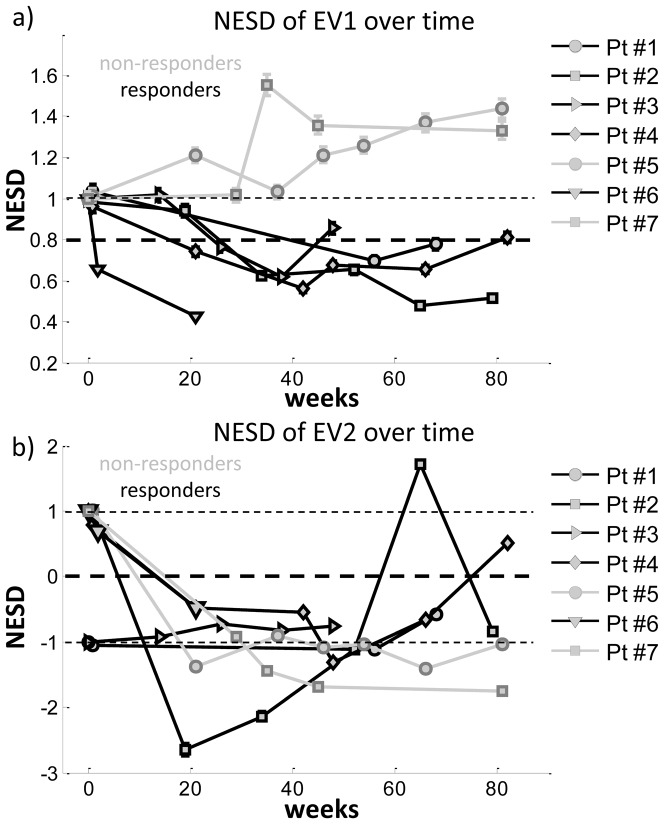
Diffuse multi-spectral imaging has been evaluated as a potential non-invasive marker of tumor response. Multi-spectral images of Kaposi sarcoma skin lesions were taken over the course of treatment, and blood volume and oxygenation concentration maps were obtained through principal component analysis (PCA) of the data. These images were compared with clinical and pathological responses determined by conventional means. We demonstrate that cutaneous lesions have increased blood volume concentration and that changes in this parameter are a reliable indicator of treatment efficacy, differentiating responders and non-responders. Blood volume decreased by at least 20% in all lesions that responded by clinical criteria and increased in the two lesions that did not respond clinically. Responses as assessed by multi-spectral imaging also generally correlated with overall patient clinical response assessment, were often detectable earlier in the course of therapy, and are less subject to observer variability than conventional clinical assessment. Tissue oxygenation was more variable, with lesions often showing decreased oxygenation in the center surrounded by a zone of increased oxygenation. This technique could potentially be a clinically useful supplement to existing response assessment in KS, providing an early, quantitative, and non-invasive marker of treatment effect.


Conflict of interest statement

Competing Interests: The authors have declared that no competing interests exist.

Figures

Figure 1
Figure 1. Multi-spectral instrument.
Linearly polarized light is projected onto the skin and diffuse reflectance images are captured at the CCD camera after passing narrow band filters for wavelength selection.
Figure 2
Figure 2. Cross-sections through blood volume and blood oxygenation at baseline in a KS lesion.
Cross-sections were chosen to be centered on the lesion, for both blood volume (a) and oxygenation (c). The EV1 and EV2 are depicted in arbitrary units as in Fig. 2. The average of 5 cross sections for blood volume (b) shows the typical increase and for oxygenation (d) shows a decrease inside the lesion area. A surrounding halo of increased oxygenation can be seen, especially to the immediate right of the lesion. The width of the lines in (b) and (d) reflect the range of +/− 1 standard deviation for the 11 cross sections at each point.
Figure 3
Figure 3. Eigenvector converted blood volume (EV1) and oxygenation (EV2) images.
Two adjacent KS lesions over time are shown in the images in arbitrary units of a patient with a confirmed pathological complete response. A digital photograph of the lesions is shown at baseline (week 0).
Figure 4
Figure 4. Eigenvector converted blood volume (EV1) and oxygenation (EV2) images.
The KS lesion is shown over time in arbitrary units of a patient with progressive disease. A digital photograph of the lesion is shown at baseline (week 0).
Figure 5
Figure 5. Time courses of NESD for EV1 and EV2.
(a) Time course for the NESD of blood volume (EV1) for 5 lesions that showed a clinical response (black) and two lesions that did not show a clinical response (grey). Patients whose lesion responded to treatment show a clear decrease in NESD of blood volume (EV1) over time, whereas those whose lesion progressed show an increase. (b) Time course for the NESD of blood oxygenation (EV2); again the 5 lesions that responded clinically are shown in black, and the 2 lesions that did not respond are shown in grey. The errobars shown correspond to the error on the estimate of the standard deviation. If the errorbar is not visible, the error is smaller than the marker size.

References

    1. Chang Y, Cesarman E, Pessin MS, Lee F, Culpepper J, et al. (1994) Identification of herpesvirus-like DNA sequences in AIDS-associated Kaposi's sarcoma. Science 266: 1865–1869. - PubMed
    1. Sakakibara S, Tosato G (2011) Viral interleukin-6: role in Kaposi's sarcoma-associated herpesvirus: associated malignancies. Journal of interferon & cytokine research : the official journal of the International Society for Interferon and Cytokine Research 31: 791–801. - PMC - PubMed
    1. Bubman D, Cesarman E (2003) Pathogenesis of Kaposi's sarcoma. Hematology/oncology clinics of North America 17: 717–745. - PubMed
    1. Gasperini P, Sakakibara S, Tosato G (2008) Contribution of viral and cellular cytokines to Kaposi's sarcoma-associated herpesvirus pathogenesis. Journal of leukocyte biology 84: 994–1000. - PMC - PubMed
    1. Uldrick TS, Wang V, O'Mahony D, Aleman K, Wyvill KM, et al. (2010) An interleukin-6-related systemic inflammatory syndrome in patients co-infected with Kaposi sarcoma-associated herpesvirus and HIV but without Multicentric Castleman disease. Clinical infectious diseases : an official publication of the Infectious Diseases Society of America 51: 350–358. - PMC - PubMed

Publication types