. 2013 Dec 27;8(12):e83899.
doi: 10.1371/journal.pone.0083899. eCollection 2013.

The influence of neuronal density and maturation on network activity of hippocampal cell cultures: a methodological study

Affiliations

The influence of neuronal density and maturation on network activity of hippocampal cell cultures: a methodological study

Emilia Biffi et al. PLoS One. .

Abstract

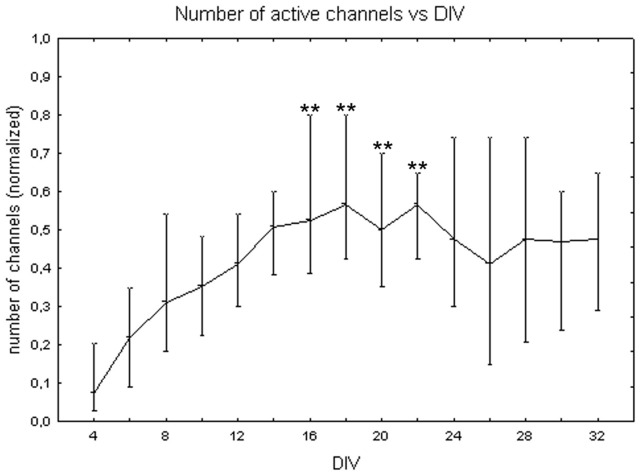
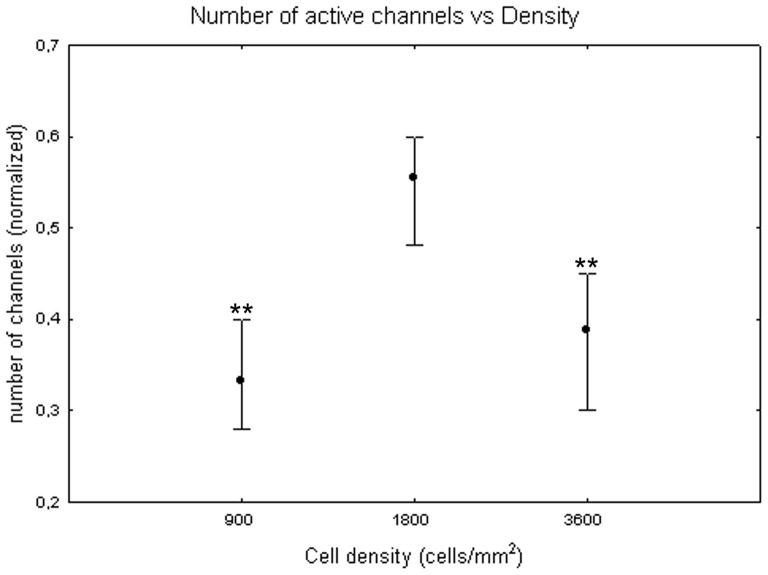
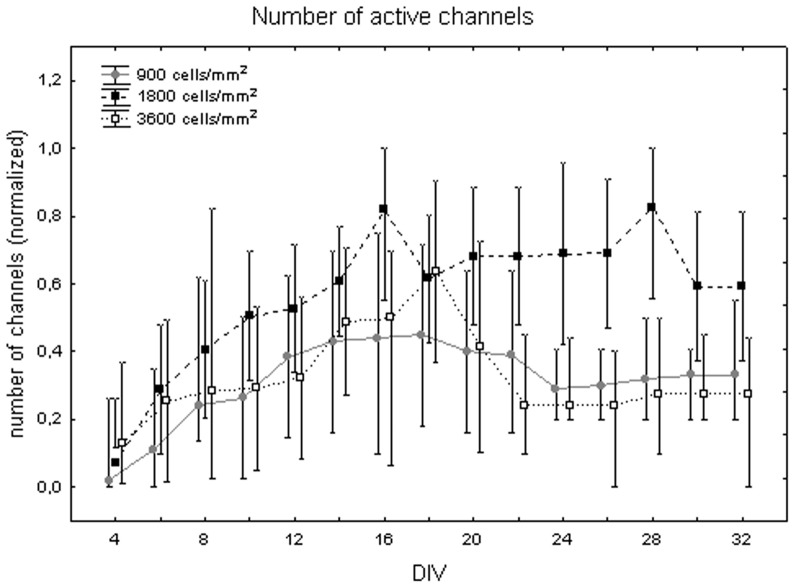
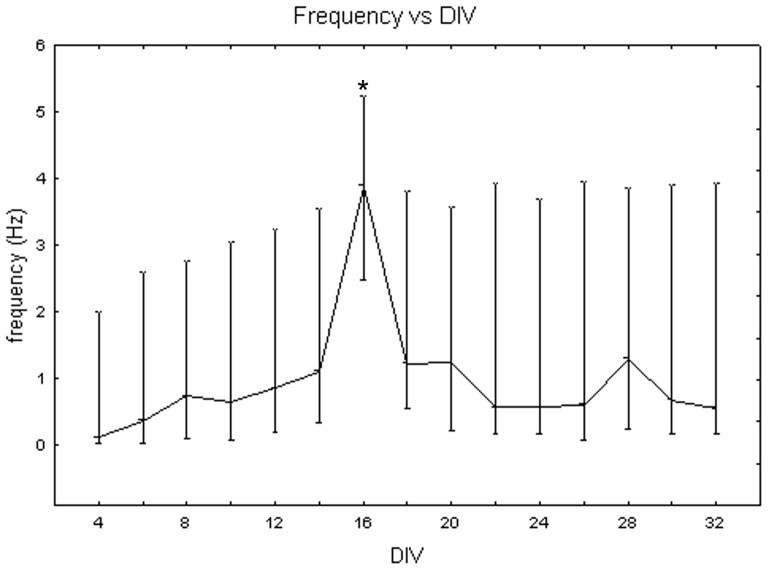
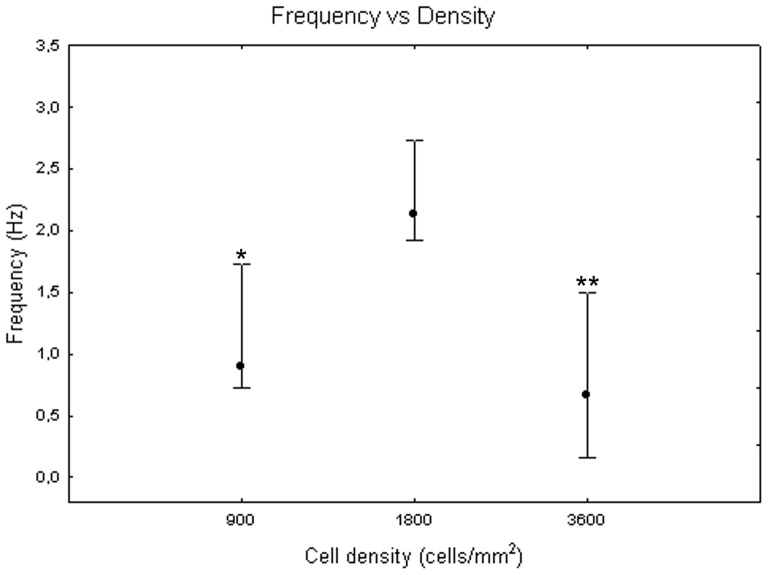
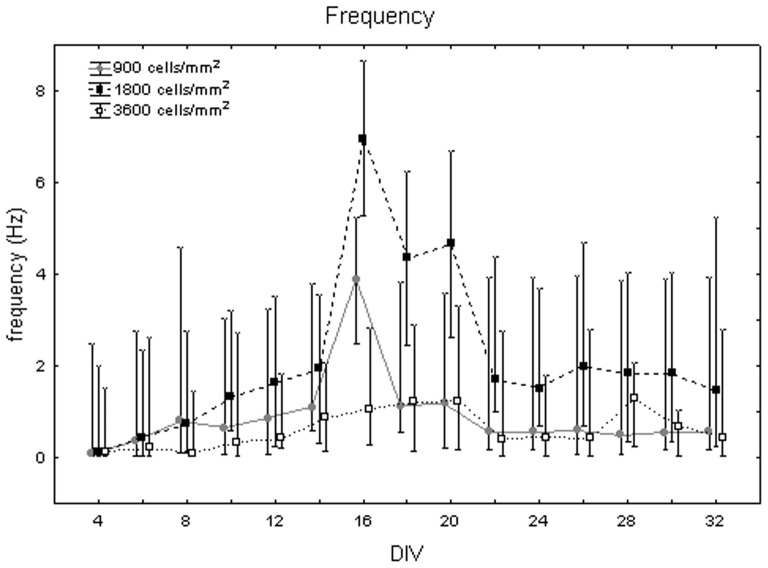
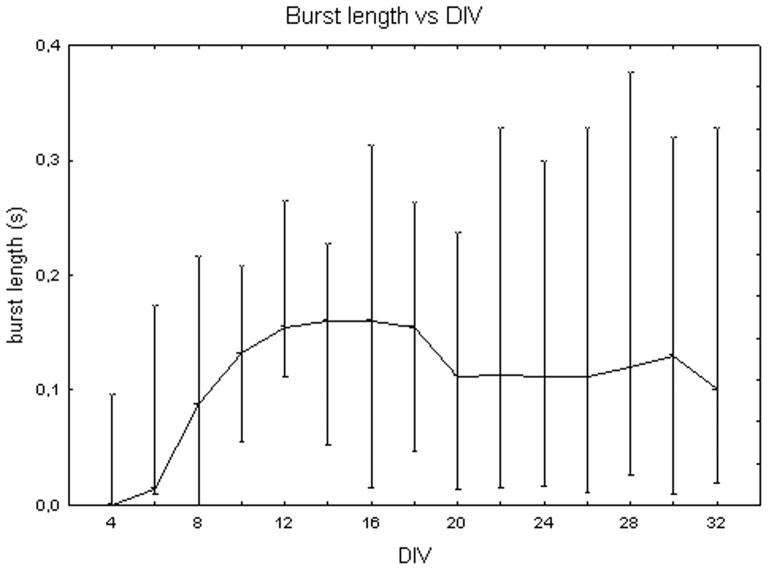
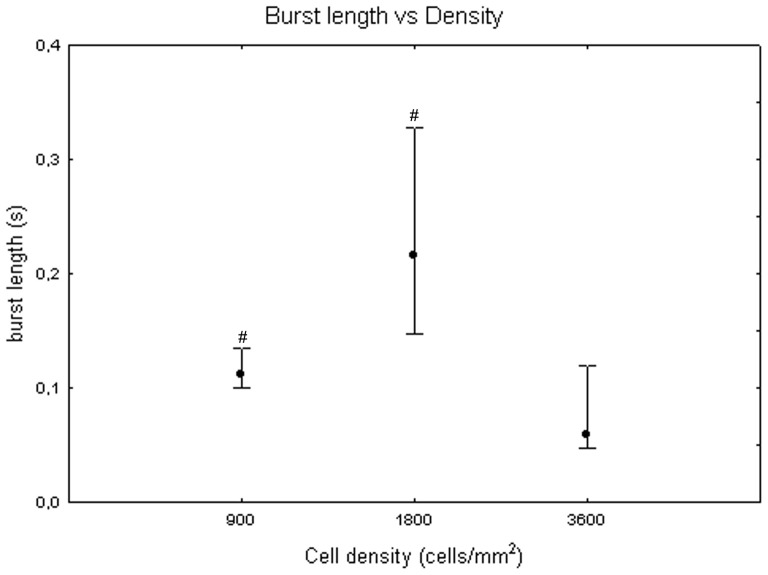
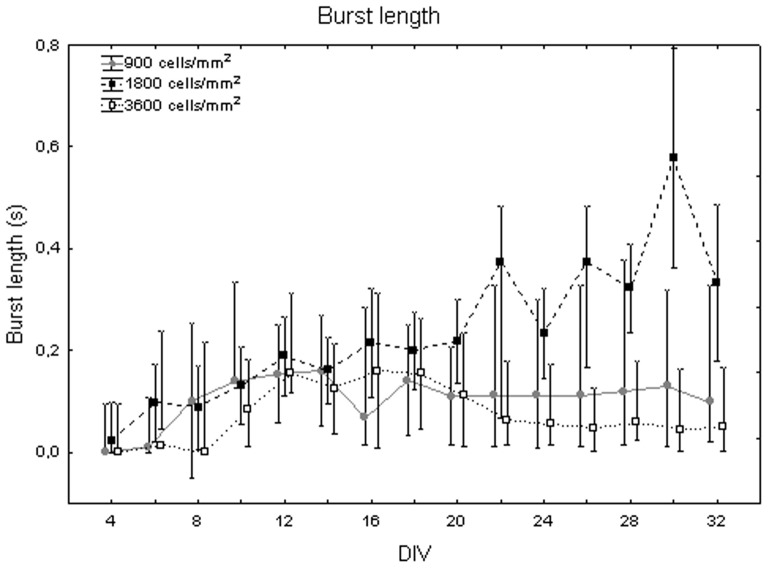
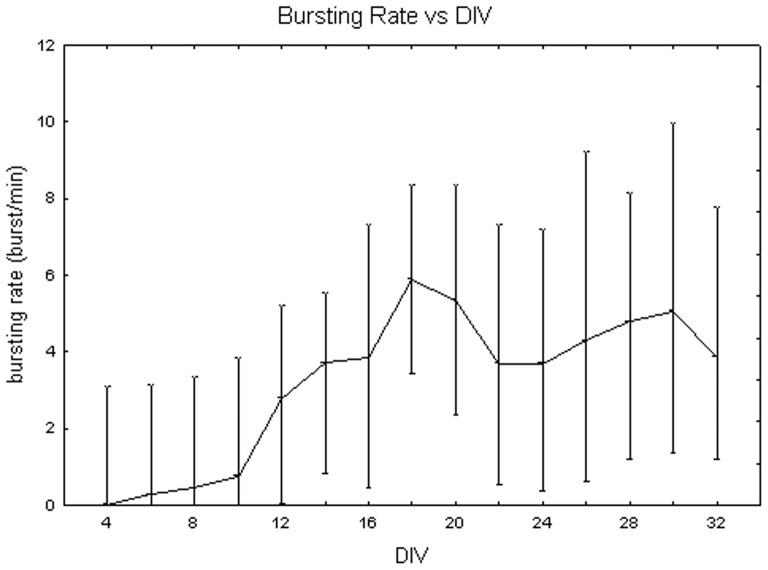
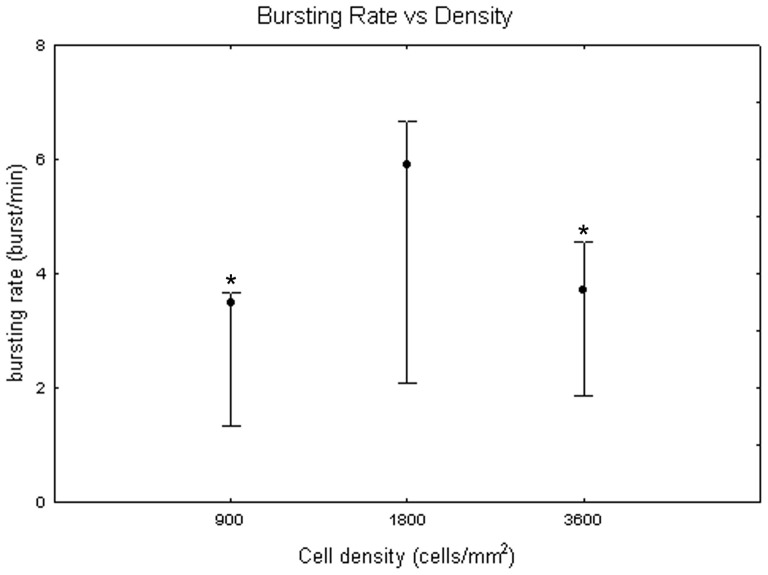
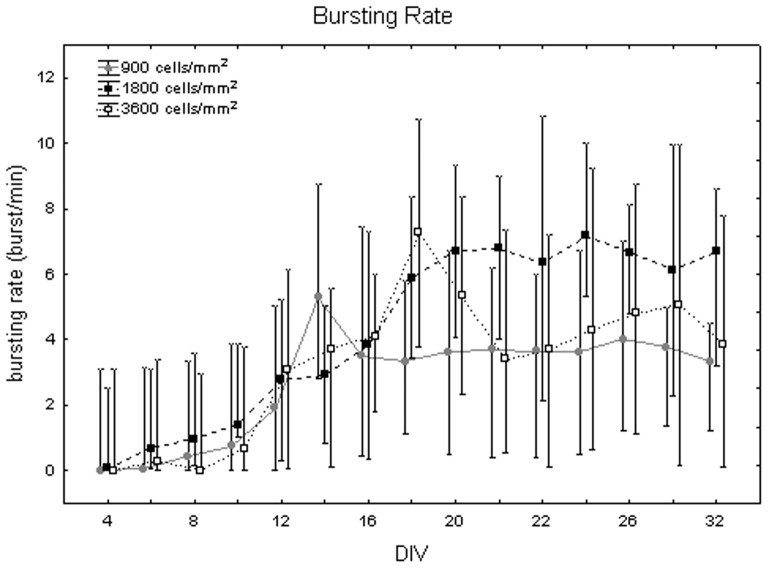
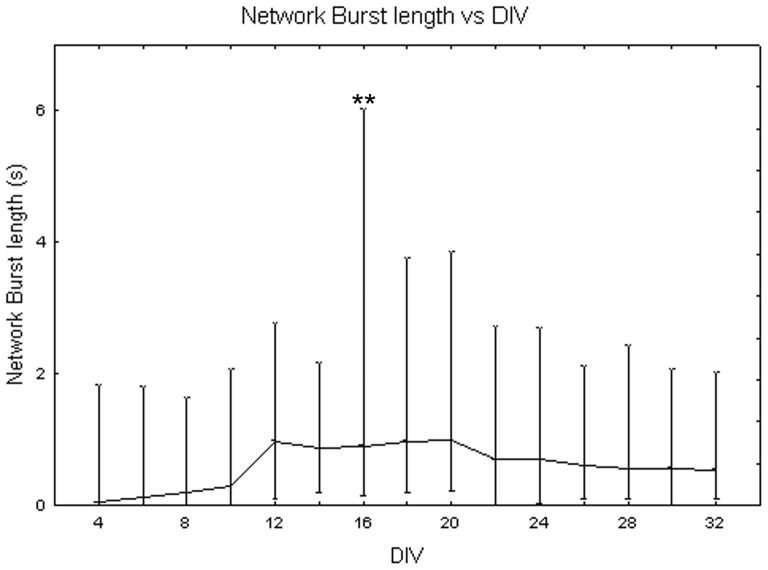
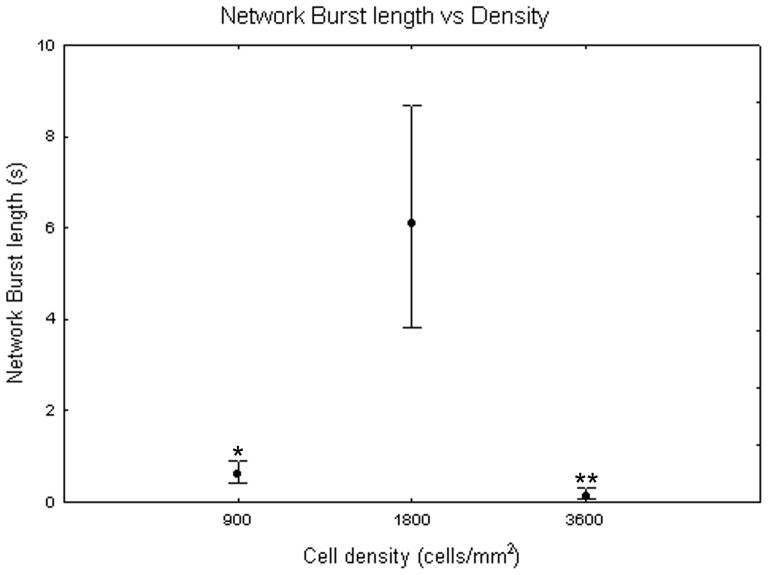
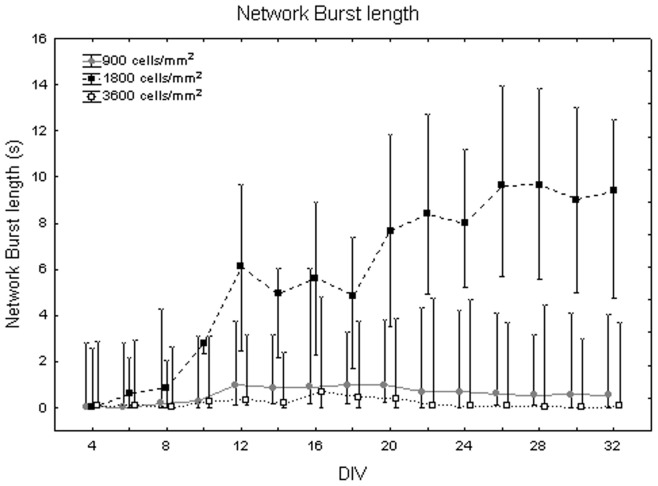
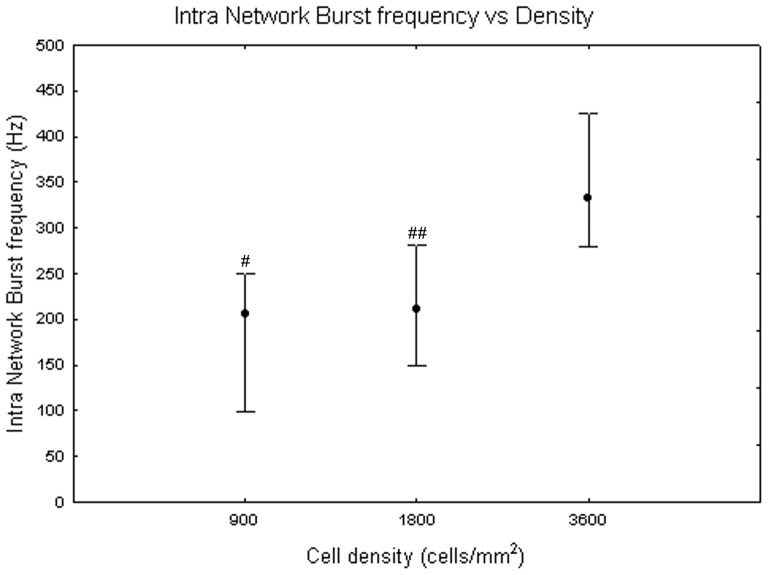
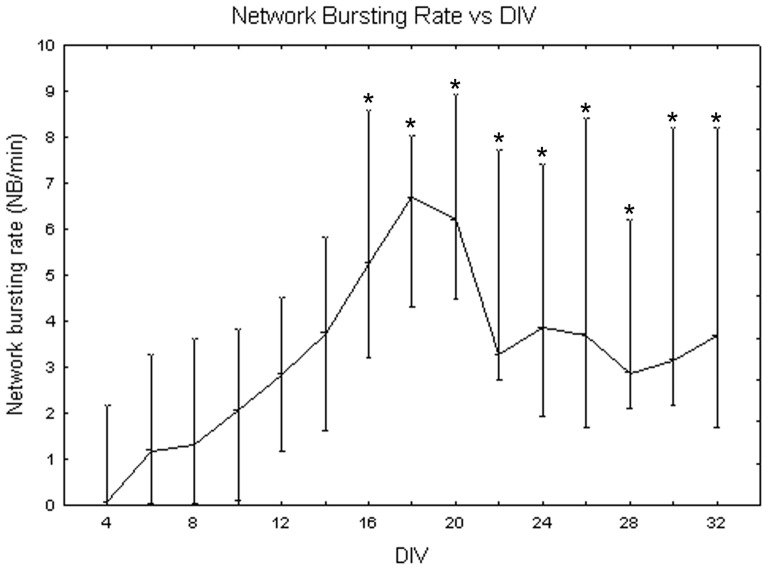
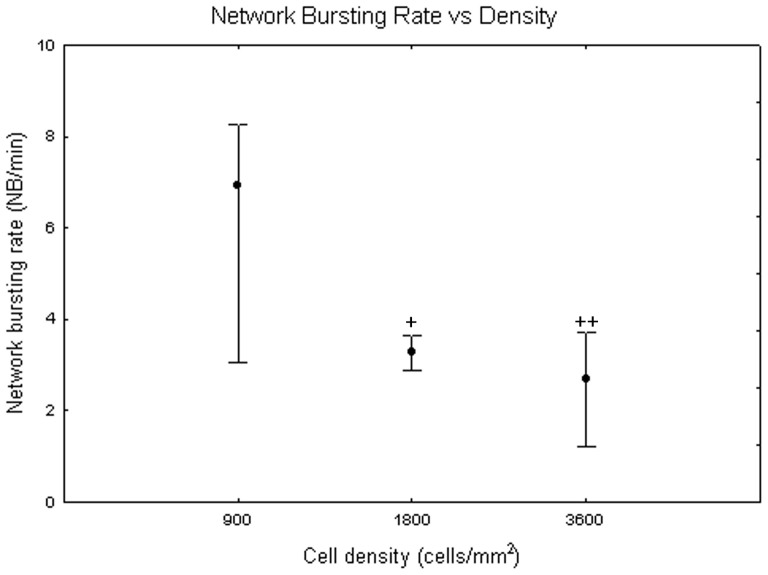
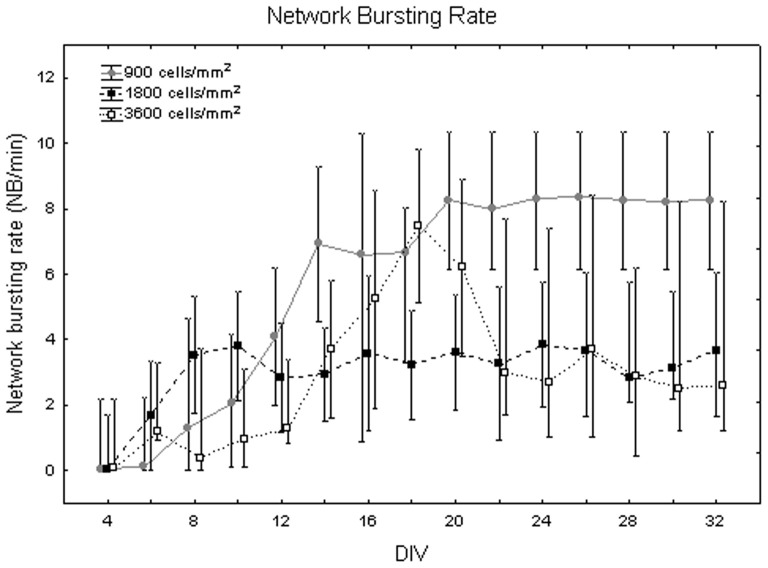
It is known that cell density influences the maturation process of in vitro neuronal networks. Neuronal cultures plated with different cell densities differ in number of synapses per neuron and thus in single neuron synaptic transmission, which results in a density-dependent neuronal network activity. Although many authors provided detailed information about the effects of cell density on neuronal culture activity, a dedicated report of density and age influence on neuronal hippocampal culture activity has not yet been reported. Therefore, this work aims at providing reference data to researchers that set up an experimental study on hippocampal neuronal cultures, helping in planning and decoding the experiments. In this work, we analysed the effects of both neuronal density and culture age on functional attributes of maturing hippocampal cultures. We characterized the electrophysiological activity of neuronal cultures seeded at three different cell densities, recording their spontaneous electrical activity over maturation by means of MicroElectrode Arrays (MEAs). We had gather data from 86 independent hippocampal cultures to achieve solid statistic results, considering the high culture-to-culture variability. Network activity was evaluated in terms of simple spiking, burst and network burst features. We observed that electrical descriptors were characterized by a functional peak during maturation, followed by a stable phase (for sparse and medium density cultures) or by a decrease phase (for high dense neuronal cultures). Moreover, 900 cells/mm(2) cultures showed characteristics suitable for long lasting experiments (e.g. chronic effect of drug treatments) while 1800 cells/mm(2) cultures should be preferred for experiments that require intense electrical activity (e.g. to evaluate the effect of inhibitory molecules). Finally, cell cultures at 3600 cells/mm(2) are more appropriate for experiments in which time saving is relevant (e.g. drug screenings). These results are intended to be a reference for the planning of in vitro neurophysiological and neuropharmacological experiments with MEAs.


Conflict of interest statement

Competing Interests: The authors have declared that no competing interests exist.

Figures

Figure 1
Figure 1. Sequence of the steps to be performed to prepare MEA substrates before cell plating.
Figure 2
Figure 2. Changes of the number of active channels during cell culture maturation.
Median values include different cell densities for each DIV. Values are normalized over the total number of channels. One-way Friedman test and post-hoc Wilcoxon matched pair test **p<0.01 with respect to DIV 4 and 6.
Figure 3
Figure 3. Median number of active channels at 900, 1800 and 3600 cells/mm2.
Median values include different DIV for each cell density. Values are normalized over the total number of channels. Kruskal-Wallis test and post-hoc Mann-Whitney U test **p<0.01 with respect to cell density of 1800 cells/mm2.
Figure 4
Figure 4. Trend of the number of active channels during cell culture maturation at different cell densities.
Cell culture density equal to 900 cells/mm2 (grey dots), 1800 cells/mm2 (black squares) and 3600 cells/mm2 (white squares). Values are normalized over the total number of channels.
Figure 5
Figure 5. Changes of the mean frequency (Hz) of neuronal networks during cell culture maturation.
Median values include different cell densities for each DIV. One-way Friedman test and post-hoc Wilcoxon matched pair test *p<0.05 with respect to all the other days in culture.
Figure 6
Figure 6. Mean frequency at 900, 1800 and 3600 cells/mm2.
Median values include different DIV for each cell density. Kruskal-Wallis test and post-hoc Mann-Whitney U test *p<0.05 and **p<0.01 with respect to cell density of 1800 cells/mm2.
Figure 7
Figure 7. Mean frequency (in Hz) changes during cell culture maturation at different cell densities.
Cell culture density equal to 900 cells/mm2 (grey dots), 1800 cells/mm2 (black squares) and 3600 cells/mm2 (white squares).
Figure 8
Figure 8. Changes of the burst duration (s) during cell culture maturation.
Median values include different cell densities for each DIV.
Figure 9
Figure 9. Burst length at 900, 1800 and 3600 cells/mm2.
Median values include different DIV for each cell density. Kruskal-Wallis test and post-hoc Mann-Whitney U test #p<0.05 with respect to cell density of 3600 cells/mm2.
Figure 10
Figure 10. Changes of burst duration (s) during culture maturation at different cell densities.
Neuronal culture density equal to 900 cells/mm2 (grey dots), 1800 cells/mm2 (black squares) and 3600 cells/mm2 (white squares).
Figure 11
Figure 11. Changes of the bursting rate (bursts per minute) during cell culture maturation.
Median values include different cell densities for each DIV.
Figure 12
Figure 12. Bursting rate (bursts per minute) at 900, 1800 and 3600 cells/mm2.
Median values include different DIV for each cell density. Kruskal-Wallis test and post-hoc Mann-Whitney U test *p<0.05 with respect to cell density of 1800 cells/mm2.
Figure 13
Figure 13. Bursting rate (bursts/min) during maturation at different cell densities.
Cell culture density equal to 900 cells/mm2 (grey dots), 1800 cells/mm2 (black squares) and 3600 cells/mm2 (white squares).
Figure 14
Figure 14. Changes of network burst length (s) during cell culture maturation.
Median values include different cell densities for each DIV. One-way Friedman test and post-hoc Wilcoxon matched pair test **p<0.01 with respect to all the other days in culture.
Figure 15
Figure 15. Network burst length (s) at 900, 1800 and 3600 cells/mm2.
Median values include different DIV for each cell density. Kruskal-Wallis test and post-hoc Mann-Whitney U test *p<0.05 and **p<0.01 with respect to cell density of 1800 cells/mm2.
Figure 16
Figure 16. Changes of mean duration of NBs (s) during maturation at different cell densities.
Neuronal culture density equal to 900 cells/mm2 (grey dots), 1800 cells/mm2 (black squares) and 3600 cells/mm2 (white squares).
Figure 17
Figure 17. Intra network burst frequency at 900, 1800 and 3600 cells/mm2.
Median values include different DIV for each cell density. Kruskal-Wallis test and post-hoc Mann-Whitney U test #p<0.05 and ##p<0.01 with respect to cell density of 3600 cells/mm2.
Figure 18
Figure 18. Network bursting rate (Hz) during cell culture maturation.
Median values include different cell densities for each DIV. One-way Friedman test and post-hoc Wilcoxon matched pair test *p<0.05 with respect to the first and second weeks (from DIV 4 to DIV 14).
Figure 19
Figure 19. Network bursting rate (Hz) at 900, 1800 and 3600 cells/mm2.
Median values include different DIV for each cell density. Kruskal-Wallis test and post-hoc Mann-Whitney U test +p<0.05 and ++p<0.01 with respect to cell density of 900 cells/mm2.
Figure 20
Figure 20. Network bursting rate (NB/min) during maturation at the three densities under study.
Cell culture density equal to 900 cells/mm2 (grey dots), 1800 cells/mm2 (black squares) and 3600 cells/mm2 (white squares).

References

    1. Morin F, Takamura Y, Tamiya E (2005) Investigating neuronal activity with planar microelectrode arrays: achievements and new perspectives. J Biosci Bioeng 100: 131–143. - PubMed
    1. Ben-Ari Y (2001) Developing networks play a similar melody. Trends Neurosci 24: 353–360. - PubMed
    1. Chiappalone M, Bove M, Vato A, Tedesco M, Martinoia S (2006) Dissociated cortical networks show spontaneously correlated activity patterns during in vitro development. Brain Res 1093: 41–53. - PubMed
    1. Ichikawa M, Muramoto K, Kobayashi K, Kawahara M, Kuroda Y (1993) Formation and maturation of synapses in primary cultures of rat cerebral cortical cells: An electron microscopic study. Neurosci Res 16: 95–103. - PubMed
    1. Biffi E, Menegon A, Piraino F, Pedrocchi A, Fiore GB, et al. (2012) Validation of Long-Term Primary Neuronal Cultures and Network Activity Through the Integration of Reversibly Bonded Microbioreactors and MEA Substrates. Biotechnol Bioeng 109: 166–75. - PubMed

LinkOut - more resources