

8-spot smFRET analysis using two 8-pixel SPAD arrays
- PMID: 24386541
- PMCID: PMC3877251
- DOI: 10.1117/12.2003704
8-spot smFRET analysis using two 8-pixel SPAD arrays
Abstract
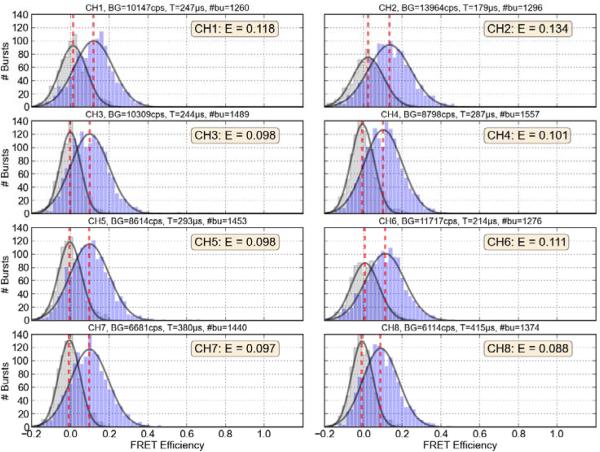
Single-molecule Förster resonance energy transfer (smFRET) techniques are now widely used to address outstanding problems in biology and biophysics. In order to study freely diffusing molecules, current approaches consist in exciting a low concentration (<100 pM) sample with a single confocal spot using one or more lasers and detecting the induced single-molecule fluorescence in one or more spectrally- and/or polarization-distinct channels using single-pixel Single-Photon Avalanche Diodes (SPADs). A large enough number of single-molecule bursts must be accumulated in order to compute FRET efficiencies with sufficient statistics. As a result, the minimum timescale of observable phenomena is set by the minimum acquisition time needed for accurate measurements, typically a few minutes or more, limiting this approach mostly to equilibrium studies. Increasing smFRET analysis throughput would allow studying dynamics with shorter timescales. We recently demonstrated a new multi-spot excitation approach, employing a novel multi-pixel SPAD array, using a simplified dual-view setup in which a single 8-pixel SPAD array was used to collect FRET data from 4 independent spots. In this work we extend our results to 8 spots and use two 8-SPAD arrays to collect donor and acceptor photons and demonstrate the capabilities of this system by studying a series of doubly labeled dsDNA samples with different donor-acceptor distances ranging from low to high FRET efficiencies. Our results show that it is possible to enhance the throughput of smFRET measurements in solution by almost one order of magnitude, opening the way for studies of single-molecule dynamics with fast timescale once larger SPAD arrays become available.
Keywords: FRET; SPAD; SPAD arrays; high-throughput; multi-spot; photon-counting; single molecule; smFRET.
Figures


References
-
- Weiss S. Fluorescence Spectroscopy of Single Biomolecules. Science. 1999;283(5408):1676–1683. - PubMed
-
- Weiss S. Measuring conformational dynamics of biomolecules by single molecule fluorescence spectroscopy. Nat. Struct. Mol. Biol. 2000;7(9):724–9. - PubMed
-
- Kapanidis AN, Margeat E, Laurence TA, Doose S, Ho SO, Mukhopadhyay J, Kortkhonjia E, Mekler V, Ebright RH, et al. Retention of transcription initiation factor sigma70 in transcription elongation: single-molecule analysis. Mol. Cell. 2005;20(3):347–56. - PubMed
Grants and funding
LinkOut - more resources
Full Text Sources
Other Literature Sources
Research Materials