

A morphometric and histological study of placental malaria shows significant changes to villous architecture in both Plasmodium falciparum and Plasmodium vivax infection
- PMID: 24386908
- PMCID: PMC3900675
- DOI: 10.1186/1475-2875-13-4
A morphometric and histological study of placental malaria shows significant changes to villous architecture in both Plasmodium falciparum and Plasmodium vivax infection
Abstract
Background: Malaria in pregnancy remains a major health problem. Placental malaria infection may cause pathophysiological changes in pregnancy and result in morphological changes to placental villi. Quantitative histomorphological image analysis of placental biopsies was performed to compare placental villous architecture between active or treated placental malaria cases and controls.
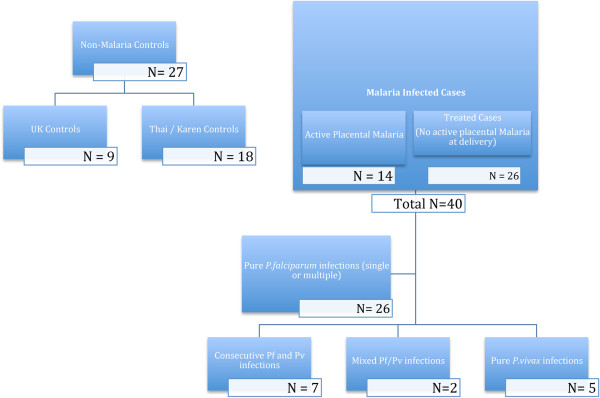
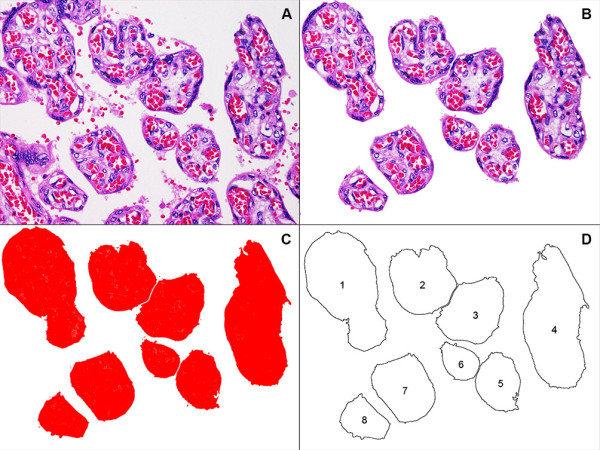
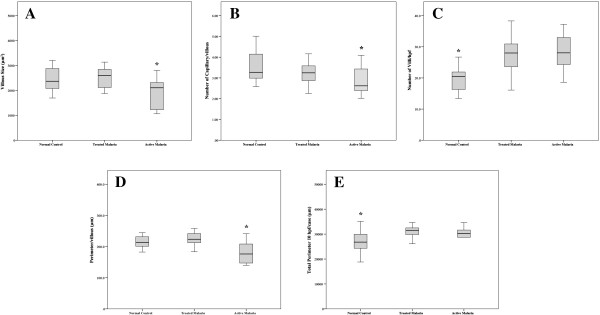
Methods: A total of 67 placentas were studied from three clinical groups: control patients who did not have malaria (n = 27), active (n = 14) and treated (n=26) malaria cases, including both Plasmodium falciparum and Plasmodium vivax infections. Image analysis of histological placental sections was performed using ImageJ software to measure the number and size (area) of terminal villi, perimeter measurement per villus and total perimeter per unit area, and number of capillaries per villus (vascularity). Histological features of placental malaria were scored and these results were correlated with malaria status and clinical outcomes.
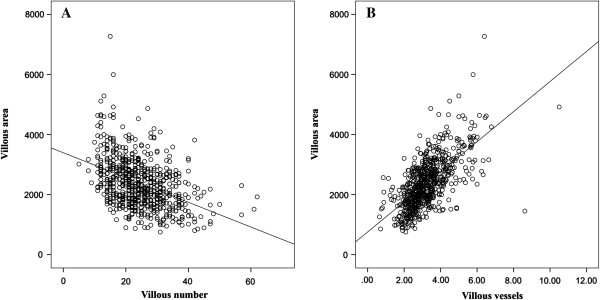
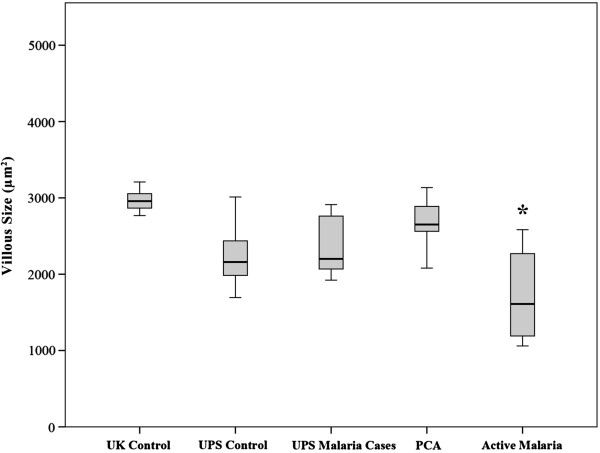
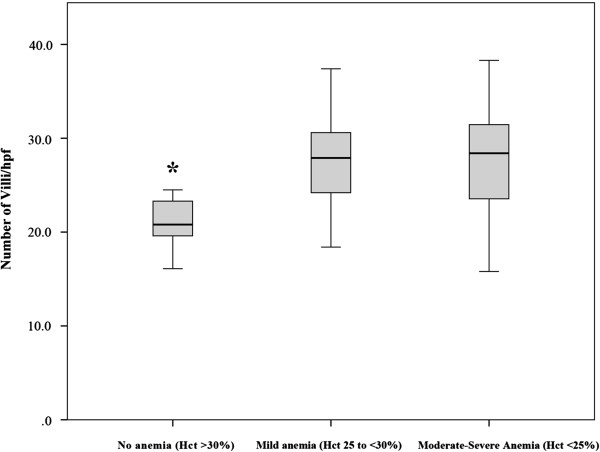
Results: Villous size correlated with vascularity (p <0.0001) but was inversely correlated with observed villi per unit area, (p = 0.0001). Significantly greater villous area and vascularity was observed in UK controls. Indices of histological malaria infection were significantly greater in active versus treated malaria cases. Active placental malaria cases showed significantly smaller villous area (p <0.0084), vascularity (p <0.0139) and perimeter (p <0.0006) than treated malaria cases or controls, but significantly more villi per unit area (p <0.0001). Villous size in treated malaria cases was significantly larger than active placental malaria cases (p <0.001) and similar to controls. There was a significant relationship between villous number and anaemia at the time of infection (p <0.0034), but not placental weight, birth weight or gestational age at delivery. No differences were found between histology or villous morphology comparing infections with P. falciparum or P. vivax.
Conclusions: These results imply that villous size, perimeter and vascularity are acutely decreased during active placental malaria, decreasing the surface area available for gas exchange per villus. However the increased number of villi per unit area offsets this change and persists after treatment. Histopathological and villous architectural changes may be reversed by early detection and appropriate anti-malarial treatment.
Figures
Similar articles
-
Placental histopathological changes associated with Plasmodium vivax infection during pregnancy.PLoS Negl Trop Dis. 2013;7(2):e2071. doi: 10.1371/journal.pntd.0002071. Epub 2013 Feb 14. PLoS Negl Trop Dis. 2013. PMID: 23459254 Free PMC article.
-
The effects of Plasmodium falciparum and P. vivax infections on placental histopathology in an area of low malaria transmission.Am J Trop Med Hyg. 2004 Apr;70(4):398-407. Am J Trop Med Hyg. 2004. PMID: 15100454
-
Genotype comparison of Plasmodium vivax and Plasmodium falciparum clones from pregnant and non-pregnant populations in North-west Colombia.Malar J. 2012 Nov 26;11:392. doi: 10.1186/1475-2875-11-392. Malar J. 2012. PMID: 23181896 Free PMC article.
-
Prevalence and risk factors related to poor outcome of patients with severe Plasmodium vivax infection: a systematic review, meta-analysis, and analysis of case reports.BMC Infect Dis. 2020 May 24;20(1):363. doi: 10.1186/s12879-020-05046-y. BMC Infect Dis. 2020. PMID: 32448216 Free PMC article.
-
The co-existence of Plasmodium: sidelights from falciparum and vivax malaria in Thailand.Trends Parasitol. 2004 Jul;20(7):333-9. doi: 10.1016/j.pt.2004.05.004. Trends Parasitol. 2004. PMID: 15193565 Review. No abstract available.
Cited by
-
Malaria and immunity during pregnancy and postpartum: a tale of two species.Parasitology. 2015 Jul;142(8):999-1015. doi: 10.1017/S0031182015000074. Epub 2015 Mar 3. Parasitology. 2015. PMID: 25731914 Free PMC article. Review.
-
Malaria in Pregnancy Interacts with and Alters the Angiogenic Profiles of the Placenta.PLoS Negl Trop Dis. 2015 Jun 19;9(6):e0003824. doi: 10.1371/journal.pntd.0003824. eCollection 2015. PLoS Negl Trop Dis. 2015. PMID: 26090803 Free PMC article.
-
Mother-to-Children Plasmodium falciparum Asymptomatic Malaria Transmission at Saint Camille Medical Centre in Ouagadougou, Burkina Faso.Malar Res Treat. 2014;2014:390513. doi: 10.1155/2014/390513. Epub 2014 Nov 23. Malar Res Treat. 2014. PMID: 25506464 Free PMC article.
-
Placental Structure in Preterm Birth Among HIV-Positive Versus HIV-Negative Women in Kenya.J Acquir Immune Defic Syndr. 2019 Jan 1;80(1):94-102. doi: 10.1097/QAI.0000000000001871. J Acquir Immune Defic Syndr. 2019. PMID: 30272633 Free PMC article.
-
Insights into the Cytoadherence Phenomenon of Plasmodium vivax: The Putative Role of Phosphatidylserine.Front Immunol. 2017 Sep 20;8:1148. doi: 10.3389/fimmu.2017.01148. eCollection 2017. Front Immunol. 2017. PMID: 28979260 Free PMC article. Review.
References
-
- WHO. Malaria in pregnancy: Guidelines for measuring key monitoring and evaluation indicators. Geneva: World Health Organization; 2007.
-
- Rogerson SJ, Mwapasa V, Meshnick SR. Malaria in pregnancy: linking immunity and pathogenesis to prevention. Am J Trop Med Hyg. 2007;77:14–22. - PubMed
Publication types
MeSH terms
Substances
Grants and funding
LinkOut - more resources
Full Text Sources
Other Literature Sources
Medical
