. 2014 Jan 3:15:8.
doi: 10.1186/1471-2164-15-8.

ITEP: an integrated toolkit for exploration of microbial pan-genomes

Affiliations

ITEP: an integrated toolkit for exploration of microbial pan-genomes

Matthew N Benedict et al. BMC Genomics. .

Abstract

Background: Comparative genomics is a powerful approach for studying variation in physiological traits as well as the evolution and ecology of microorganisms. Recent technological advances have enabled sequencing large numbers of related genomes in a single project, requiring computational tools for their integrated analysis. In particular, accurate annotations and identification of gene presence and absence are critical for understanding and modeling the cellular physiology of newly sequenced genomes. Although many tools are available to compare the gene contents of related genomes, new tools are necessary to enable close examination and curation of protein families from large numbers of closely related organisms, to integrate curation with the analysis of gain and loss, and to generate metabolic networks linking the annotations to observed phenotypes.

Results: We have developed ITEP, an Integrated Toolkit for Exploration of microbial Pan-genomes, to curate protein families, compute similarities to externally-defined domains, analyze gene gain and loss, and generate draft metabolic networks from one or more curated reference network reconstructions in groups of related microbial species among which the combination of core and variable genes constitute the their "pan-genomes". The ITEP toolkit consists of: (1) a series of modular command-line scripts for identification, comparison, curation, and analysis of protein families and their distribution across many genomes; (2) a set of Python libraries for programmatic access to the same data; and (3) pre-packaged scripts to perform common analysis workflows on a collection of genomes. ITEP's capabilities include de novo protein family prediction, ortholog detection, analysis of functional domains, identification of core and variable genes and gene regions, sequence alignments and tree generation, annotation curation, and the integration of cross-genome analysis and metabolic networks for study of metabolic network evolution.

Conclusions: ITEP is a powerful, flexible toolkit for generation and curation of protein families. ITEP's modular design allows for straightforward extension as analysis methods and tools evolve. By integrating comparative genomics with the development of draft metabolic networks, ITEP harnesses the power of comparative genomics to build confidence in links between genotype and phenotype and helps disambiguate gene annotations when they are evaluated in both evolutionary and metabolic network contexts.


Figures

Figure 1
Figure 1
Overview of the ITEP toolkit. The ITEP toolkit is organized so that analyses can be performed in a three-step process. Step 1: The ITEP toolkit takes three inputs: Genbank files of genomes; user-defined groupings of input organisms in which to identify protein families; and clustering parameters that define the details of the clustering method used to identify the families. Step 2: The user calls provided setup scripts to build a SQLite database containing pre-computed data such as homology and clustering results. Step 3: After building the database, a user can use the provided interfaces to the database to identify core and variable genes, build protein and organism phylogenies, curate amd visualize protein families, or build draft metabolic reconstructions from a reference network. To accomplish ITEP interfaces with the SQLite database and many previously existing bioinformatics and programming packages [28-37].
Figure 2
Figure 2
Illustration of ITEP’s capabilities for studying gene gain and loss patterns across a phylogeny. The node labels are the number of gene families (as computed by an MCL clustering of BLASTP results for both complete and draft genomes) that have at least one representative in each child of that node. Labels also contain a node identifier (N95) that can be used to look up the identities of all of the conserved families in tables outputted by the program. Examples of conserved families at node N95 are shown beneath the tree. The tree was generated from a concatenated alignment of ribosomal proteins uniquely identified in all of the genomes (17 families) with ITEP’s scripts, using FastTree [36] and a WAG model of evolution. Clusters were generated with the parameters: MCL clustering, inflation parameter of 2.0 (default for MCL), maxbit score, cutoff of 0.3. The tree was drawn with FigTree [43].
Figure 3
Figure 3
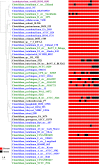
Ribosomal proteins apparently missing in draft genomes and present in all complete genomes. The heat map shows the presence (red) and absence (black) of the 17 ribosomal proteins that, according to RefSeq gene calls and the MCL clustering approach, were present in all complete Group 1 Clostridia genomes but missing in at least one draft genome within the same phylogenetic clades as the completely sequenced genomes. Blue strains: Completely sequenced genomes; green strains: draft genomes in the same clade as completely sequenced genomes; black strains: draft genomes in different clades from completely sequenced genomes. The tree is the same as that generated in Figure 2 and was visualized with ITEP scripts with some formatting changes (genome colors and column labels).
Figure 4
Figure 4
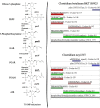
Protein family curation with ITEP. (A) A portion of the multiple alignment for the uncalled ribosomal protein L20 homologs in Acetobacterium woodii and C. perfringens str. CPE F4969, along with selected representatives of this protein from other Clostridia. Blue amino acids were conserved in more than 50% of the aligned proteins and pink amino acids are similar to the conserved acids. The figure in part (A) was generated by importing a multiple alignment generated by an ITEP script into the STRAP aligner [46]. (B) Gene neighborhoods for the proteins from part (A) attached to the maximum-likelihood phylogeny of the same proteins. Same-colored arrows indicate that the genes belonged to the same family according to MCL with the same parameters used to construct Figure 2. The visualization was done with an ITEP script.
Figure 5
Figure 5
Curation of a metabolic protein family by comparison with conserved domains. Left side: a portion of the purine synthesis pathway in the group 1 Clostridia. Right side: conserved domain architecture of two purD-purL fusions in the group 1 Clostridia as computed and displayed by ITEP tools (with minor formatting changes). The comparison makes it clear that these two proteins are fusions of purD and purL. See list of abbreviations for full compound names. Only hits to conserved domains with E-values better than 1E-100 are shown.

References

    1. Mardis ER. A decade's perspective on DNA sequencing technology. Nature. 2011;15(7333):198–203. doi: 10.1038/nature09796. - DOI - PubMed
    1. Mira A, Martin-Cuadrado AB, D'Auria G, Rodriguez-Valera F. The bacterial pan-genome:a new paradigm in microbiology. Int Microbiol. 2010;15(2):45–57. - PubMed
    1. Reno ML, Held NL, Fields CJ, Burke PV, Whitaker RJ. Biogeography of the Sulfolobus islandicus pan-genome. Proc Natl Acad Sci USA. 2009;15(21):8605–8610. doi: 10.1073/pnas.0808945106. - DOI - PMC - PubMed
    1. Maeder DL, Anderson I, Brettin TS, Bruce DC, Gilna P, Han CS, Lapidus A, Metcalf WW, Saunders E, Tapia R. et al.The Methanosarcina barkeri genome: comparative analysis with Methanosarcina acetivorans and Methanosarcina mazei reveals extensive rearrangement within methanosarcinal genomes. J Bacteriol. 2006;15(22):7922–7931. doi: 10.1128/JB.00810-06. - DOI - PMC - PubMed
    1. Huynen MA, Bork P. Measuring genome evolution. Proc Natl Acad Sci USA. 1998;15(11):5849–5856. doi: 10.1073/pnas.95.11.5849. - DOI - PMC - PubMed

Publication types

LinkOut - more resources