Renal nerve ultrastructural alterations in short term and long term experimental diabetes
- PMID: 24387617
- PMCID: PMC3937190
- DOI: 10.1186/1471-2202-15-5
Renal nerve ultrastructural alterations in short term and long term experimental diabetes
Abstract
Background: Despite the evidence that renal hemodynamics is impaired in experimental diabetes, associated with glomeruli structural alterations, renal nerves were not yet investigated in experimental models of diabetes and the contribution of nerve alterations to the diabetic nephropathy remains to be investigated. We aimed to determine if ultrastructural morphometric parameters of the renal nerves are affected by short term and/or long term experimental diabetes and if insulin treatment reverses these alterations. Left renal nerves were evaluated 15 days or 12 weeks (N = 10 in each group) after induction of diabetes, with a single injection of streptozotocin (STZ). Control rats (N = 10 in each group) were injected with vehicle (citrate buffer). Treated animals (N = 10 in each group) received a single subcutaneous injection of insulin on a daily basis. Arterial pressure, together with the renal nerves activity, was recorded 15 days (short-term) or 12 weeks (long-term) after STZ injection. After the recordings, the renal nerves were dissected, prepared for light and transmission electron microscopy, and fascicle and fibers morphometry were carried out with computer software.
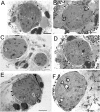
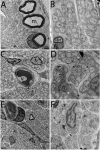
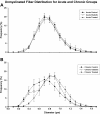
Results: The major diabetic alteration on the renal nerves was a small myelinated fibers loss since their number was smaller on chronic diabetic animals, the average morphometric parameters of the myelinated fibers were larger on chronic diabetic animals and distribution histograms of fiber diameter was significantly shifted to the right on chronic diabetic animals. These alterations began early, after 15 days of diabetes induction, associated with a severe mitochondrial damage, and were not prevented by conventional insulin treatment.
Conclusions: The experimental diabetes, induced by a single intravenous injection of STZ, in adult male Wistar rats, caused small fiber loss in the renal nerves, probably due to the early mitochondrial damage. Conventional treatment with insulin was able to correct the weight gain and metabolic changes in diabetic animals, without, however, correcting and / or preventing damage to the thin fibers caused by STZ-induced diabetes. The kidney innervation is impaired in this diabetic model suggesting that alterations of the renal nerves may play a role in the development of the diabetic nephropathy.
Figures


Similar articles
-
Ultrastructural and morphometric alterations in the aortic depressor nerve of rats due to long term experimental diabetes: effects of insulin treatment.Brain Res. 2013 Jan 23;1491:197-203. doi: 10.1016/j.brainres.2012.10.054. Epub 2012 Nov 2. Brain Res. 2013. PMID: 23123208
-
Streptozotocin induced diabetes as a model of phrenic nerve neuropathy in rats.J Neurosci Methods. 2006 Mar 15;151(2):131-8. doi: 10.1016/j.jneumeth.2005.06.024. Epub 2005 Aug 25. J Neurosci Methods. 2006. PMID: 16125783
-
Phrenic nerve diabetic neuropathy in rats: unmyelinated fibers morphometry.J Peripher Nerv Syst. 2009 Jun;14(2):137-45. doi: 10.1111/j.1529-8027.2009.00223.x. J Peripher Nerv Syst. 2009. PMID: 19691536
-
Aortic depressor nerve myelinated fibers in acute and chronic experimental diabetes.Am J Hypertens. 2006 Feb;19(2):153-60. doi: 10.1016/j.amjhyper.2005.07.023. Am J Hypertens. 2006. PMID: 16448885
-
Characterization of the development of renal injury in Type-1 diabetic Dahl salt-sensitive rats.Am J Physiol Regul Integr Comp Physiol. 2013 Oct 1;305(7):R727-34. doi: 10.1152/ajpregu.00382.2012. Epub 2013 Aug 7. Am J Physiol Regul Integr Comp Physiol. 2013. PMID: 23926133 Free PMC article.
Cited by
-
Association of chronic diabetes and hypertension in sural nerve morphometry: an experimental study.Diabetol Metab Syndr. 2015 Feb 15;7:9. doi: 10.1186/s13098-015-0005-8. eCollection 2015. Diabetol Metab Syndr. 2015. PMID: 25717348 Free PMC article.
-
Plasminogen Deficiency and Amiloride Mitigate Angiotensin II-Induced Hypertension in Type 1 Diabetic Mice Suggesting Effects Through the Epithelial Sodium Channel.J Am Heart Assoc. 2020 Dec;9(23):e016387. doi: 10.1161/JAHA.120.016387. Epub 2020 Nov 20. J Am Heart Assoc. 2020. PMID: 33215566 Free PMC article.
-
Assessment of glomerular filtration rate based on alterations of serum brain-derived neurotrophic factor in type 2 diabetic subjects treated with amlodipine/benazepril or valsartan/hydrochlorothiazide.Dis Markers. 2015;2015:780743. doi: 10.1155/2015/780743. Epub 2015 Mar 30. Dis Markers. 2015. PMID: 25918454 Free PMC article. Clinical Trial.
-
Synaptic input changes to spinal cord motoneurons correlate with motor control impairments in a type 1 diabetes mellitus model.Brain Behav. 2015 Sep 9;5(10):e00372. doi: 10.1002/brb3.372. eCollection 2015 Oct. Brain Behav. 2015. PMID: 26516607 Free PMC article.
References
-
- Shaw JE, Zimmet PZ. The epidemiology of diabetic neuropathy. Diabetes Rev. 1999;15:245–252.
-
- Lishner M, Akserrod S, Divon M, Ravid M. Spectral analysis of heart rate fluctuation. A non-invasive sensitive method for the early diagnosis of autonomic neuropathy in diabetes mellitus. J AutonNerv Syst. 1987;15:119–125. - PubMed
-
- Tomilson KC, Gardiner SM, Hebden A, Bennetti T. Functional consequences of streptozotocin-induced diabetes mellitus, with particular reference to the cardiovascular system. Pharmacol Rev. 1992;15:103–150. - PubMed
-
- McDowell TS, Hajduczok G, Abboud FM, Chapleau MW. Baroreflex disfunction in diabetes mellitus. I. Selective impairment of parasympathetic control of heart rate. Am J Physiol Heart Circ Physiol. 1994;15:H235–H243. - PubMed
Publication types
MeSH terms
Substances
LinkOut - more resources
Full Text Sources
Other Literature Sources

