Clinical Trial
. 2014 Mar;8(2):323-36.
doi: 10.1016/j.molonc.2013.12.005. Epub 2013 Dec 15.

Pre-clinical efficacy of PU-H71, a novel HSP90 inhibitor, alone and in combination with bortezomib in Ewing sarcoma

Affiliations
Clinical Trial

Pre-clinical efficacy of PU-H71, a novel HSP90 inhibitor, alone and in combination with bortezomib in Ewing sarcoma

Srikanth R Ambati et al. Mol Oncol. 2014 Mar.

Abstract

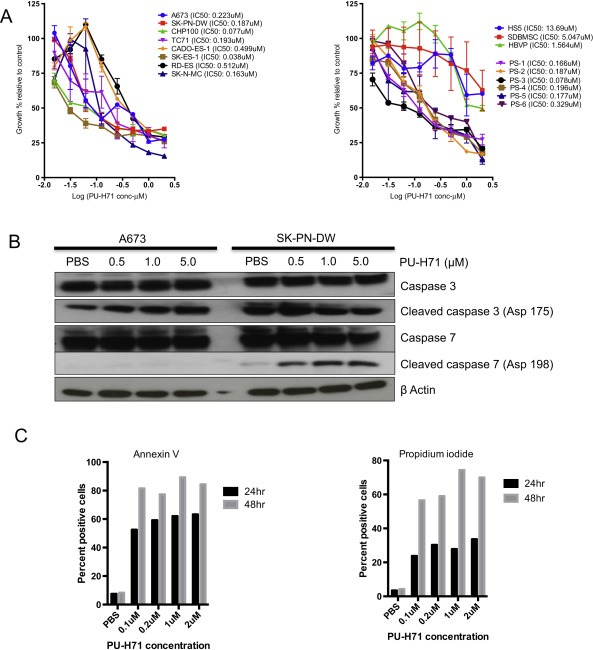
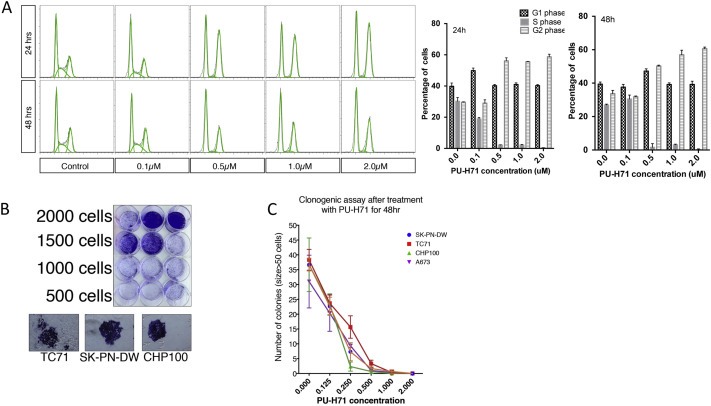
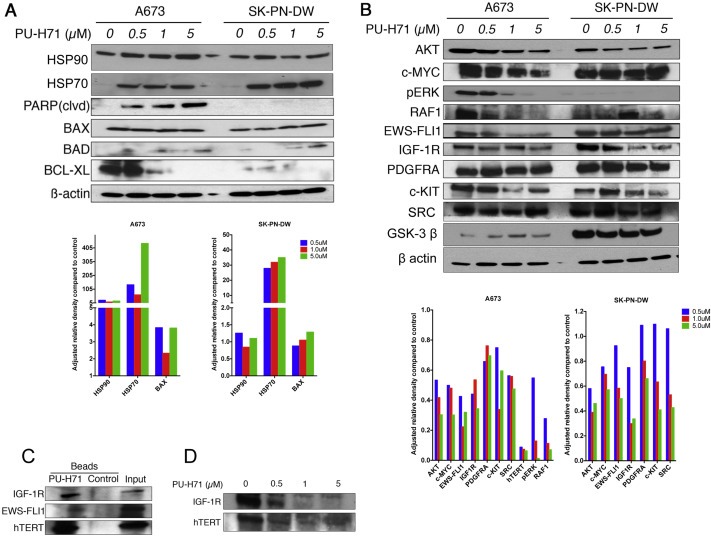
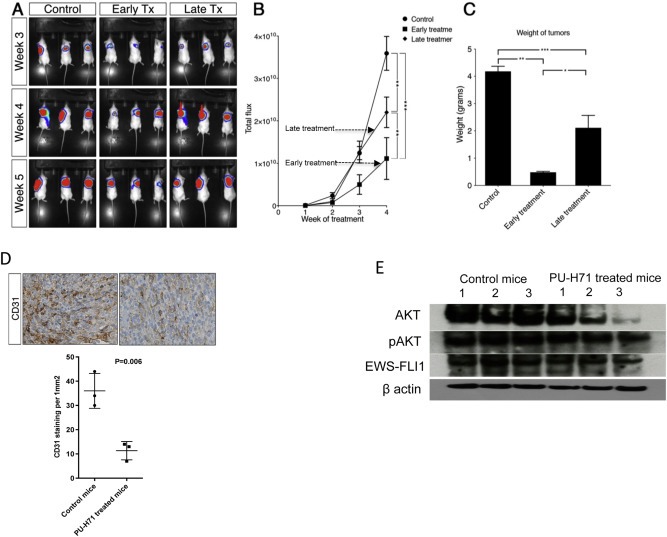
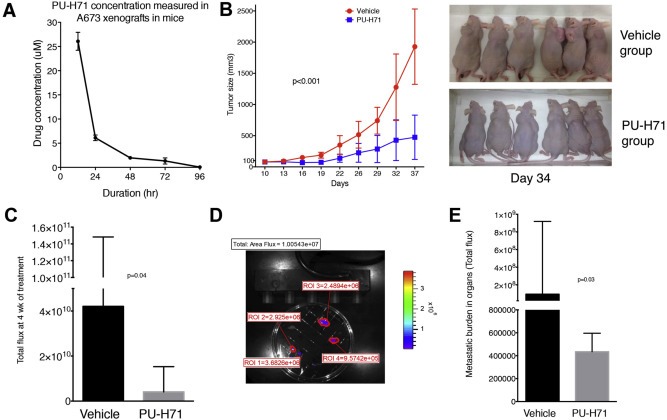
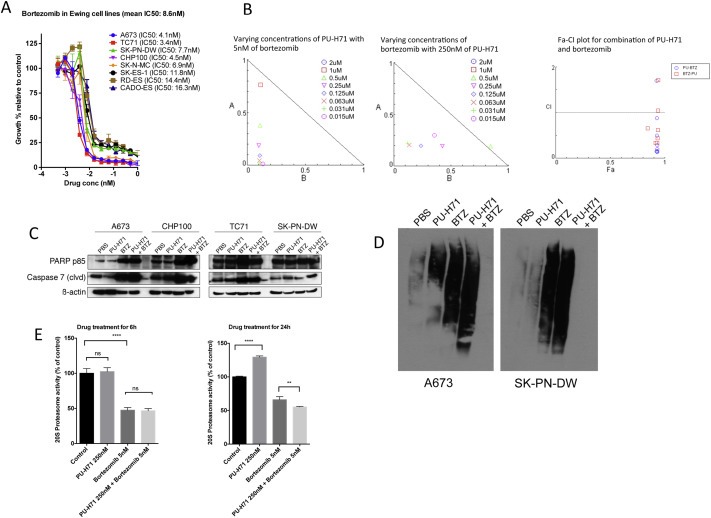
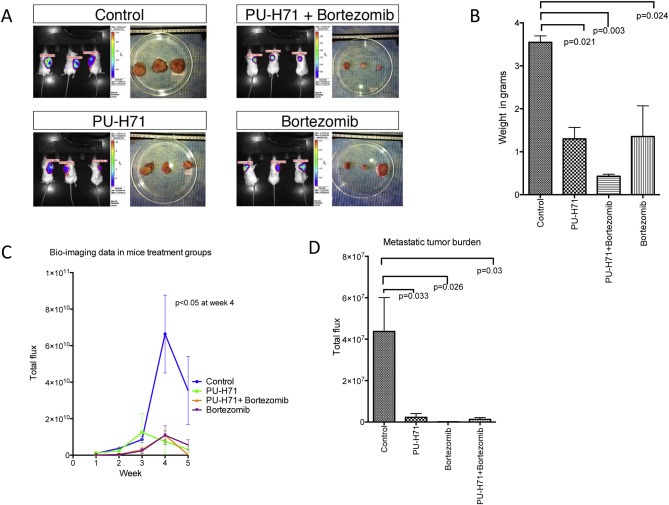
Ewing sarcoma is characterized by multiple deregulated pathways that mediate cell survival and proliferation. Heat shock protein 90 (HSP90) is a critical component of the multi-chaperone complexes that regulate the disposition and activity of a large number of proteins involved in cell-signaling systems. We tested the efficacy of PU-H71, a novel HSP90 inhibitor in Ewing sarcoma cell lines, primary samples, benign mesenchymal stromal cells and hematopoietic stem cells. We performed cell cycle analysis, clonogenic assay, immunoblot analysis and reverse phase protein array in Ewing cell lines and in vivo experiments in NSG and nude mice using the A673 cell line. We noted a significant therapeutic window in the activity of PU-H71 against Ewing cell lines and benign cells. PU-H71 treatment resulted in G2/M phase arrest. Exposure to PU-H71 resulted in depletion of critical proteins including AKT, pERK, RAF-1, c-MYC, c-KIT, IGF1R, hTERT and EWS-FLI1 in Ewing cell lines. Our results indicated that Ewing sarcoma tumor growth and the metastatic burden were significantly reduced in the mice injected with PU-H71 compared to the control mice. We also investigated the effects of bortezomib, a proteasome inhibitor, alone and in combination with PU-H71 in Ewing sarcoma. Combination index (CI)-Fa plots and normalized isobolograms indicated synergism between PU-H71 and bortezomib. Ewing sarcoma xenografts were significantly inhibited when mice were treated with the combination compared to vehicle or either drug alone. This provides a strong rationale for clinical evaluation of PU-H71 alone and in combination with bortezomib in Ewing sarcoma.

Keywords: Bortezomib; Ewing sarcoma; HSP90 inhibitor; PU-H71.


Figures

Figure 1
Figure 1
PU‐H71 induces cell death and inhibits proliferation of Ewing sarcoma cells in vitro. A, Alamar blue proliferation assay of cell lines‐A673, SK‐PN‐DW, SK‐N‐MC, SK‐ES‐1, RD‐ES, CADO‐ES‐1, CHP100 and TC71 treated with varying concentrations of PU‐H71 (from 2 μM to 0.015 μM) for 72 h (n = 3 experiments, each in triplicate). Alamar blue assay of early cultures derived from patient samples (PS‐1 to 6) and benign mesenchymal stem cells (HS5, SDBMSC and HBVP) treated with the indicated concentrations of PU‐H71. B, Western blot showing cleaved caspase 3 and caspase 7 in A673 and SK‐PN‐DW on treatment with increasing concentrations of PUH71. C, Percentage of apoptotic (Annexin V+) and necrotic (propidium iodide (PI)+) A673 cells treated with 0.1, 0.2, 1.0 and 2.0 μM concentrations of PU‐H71 at 24 and 48 h (experiment repeated twice). The kinetics of cellular metabolism as measured by alamar blue assay yields a different curve from the apoptosis and cell death assays because of the different time points when the results were obtained and the nature of the assay.
Figure 2
Figure 2
PU‐H71 induces cell cycle arrest in G2 phase in A673 cells and inhibits clonogenicity in multiple cell lines. A. Flow cytometric analysis of A673 cell line using PI staining at 24 and 48 h at indicated concentrations of PU‐H71. Also shown are the percentages of A673 cells in G1, S and G2 phases at different concentrations of PU‐H71 (experiment repeated twice). B, Colony formation was optimized using different concentration of cells in 12 well plates. Appearance of colonies (size >50 cells) that were fixed and stained with crystal violet is shown. D, Number of colonies formed for each of the cell lines‐A673, SK‐PN‐DW, CHP100 and TC71 after treatment with varying concentrations of PU‐H71 for 48 h (n = 3 experiments, each in triplicate).
Figure 3
Figure 3
PU‐H71 induces production of co‐chaperone protein, HSP70. Pro‐apoptotic proteins are increased and anti apoptotic proteins are decreased in Ewing cell lines treated with PU‐H71. A, immunoblot analysis of the indicated proteins in A673 and SK‐PN‐DW cell lines treated with 0, 0.5, 1, 5 μM concentrations of PU‐H71 for 24 h. B, immunoblot analysis of AKT, MYC, pERK, RAF‐1, EWS‐FLI1, IGF1R, PDGFRA, c‐KIT, SRC, GSK‐3β and β actin proteins in A673 and SK‐PN‐DW cell lines treated with the indicated concentrations of PU‐H71 for 24 h. Adjusted relative densities of the above proteins are shown as bar graphs below the immunoblots. C, immunoblot analyses of A673 cell lysate that was pulled down by chemical precipitation using PU‐H71 beads and control beads. IGF1R, EWS‐FLI1 and hTERT antibodies were used to locate their presence in the HSP90 chaperone complex that was pulled down. D, IGF1R and hTERT were depleted with increasing concentrations of PU‐H71 in the A673 cell line.
Figure 4
Figure 4
PU‐H71 delays initiation of tumors in the A673 xenograft model in NSG mice. A, mice injected s.q. with A673 cells expressing GFP luciferase were randomized to control, early treatment and late treatment groups and were imaged weekly. B, total flux of tumors was measured from week 2 to week 5 for control, early treatment and late treatment groups. C, The weights of tumors in the three groups at week 5. Significance is shown by p‐value <0.05 (*), <0.005 (**) and <0.0005 (***). D, Representative images of immunohistochemical staining of control and PU‐H71 treated mice tumors for CD31. Mean number of microvessels that stained positive for CD31 were counted at 200× in control and PU‐H71 treated mice tumors. E, immunoblot analysis of AKT, pAKT, EWS‐FLI1 and β actin proteins in cell lysates from tumors extracted from control mice and PU‐H71 treated mice.
Figure 5
Figure 5
PU‐H71 inhibits tumor growth and decreases metastatic burden in nude mice. A, Nude mice (n = 10) bearing A673 xenografts of approximately 100 mm3 size were given one dose of PU‐H71 at 75 mg/kg i.p. The concentration of the drug in the tumor tissue was determined by analyzing the tumors at 12, 24, 48, 72 and 96 h. B, PU‐H71 or vehicle was administered i.p. (n = 6 per group) starting at day 10 when the tumors were 50–100 mm3 size and the size of the tumors was measured twice a week. Representative image at day 34 is shown. C, Median and interquartile range of the total flux of the luminescent tumors measured at 4 wk. D, Metastatic model showing the tumor burden in various organs calculated with Living Image software. E, Median and interquartile range of flux indicating metastatic burden in both groups.
Figure 6
Figure 6
Combination of PU‐H71 and bortezomib exhibits synergism against Ewing sarcoma cells in vitro. A, Alamar blue proliferation assay of cell lines treated with varying concentrations of bortezomib (from 1 μM to 0.00048 μM) for 72 h (n = 3 experiments, each in triplicate). B, Normalized isobologram created with Compusyn software for combination of varying concentrations of PU‐H71 and IC50 of bortezomib and vice versa. Also, shown is the Fa‐combination index (CI) plot for the combinations. C, Western blot for PARP p85 and cleaved caspase 7 in 4 cell lines‐A673, CHP100, TC71 and SK‐PN‐DW treated with PBS, PU‐H71, bortezomib and combination of PU‐H71 and bortezomib for 24 h. D, immunoblot analysis of ubiquitinated proteins in A673 and SK‐PN‐DW cells treated with PBS, PU‐H71, bortezomib and combination of PU‐H71 and bortezomib for 24 h. E, A673 cells were treated with PBS, PU‐H71 250 nM, bortezomib 5 nM and combination of PU‐H71 250 nM and bortezomib 5 nM for 6 h and 24 h and their proteasome activity was measured (experiments were conducted in triplicate).
Figure 7
Figure 7
Combination of PU‐H71 and bortezomib exhibits greater inhibition of tumor growth in A673 xenograft model in NSG mice. A, Imaging at week 5 and the size of the tumors after excision are shown in all 4 groups of mice. B, Weight of the tumors, C, Total flux of the tumors imaged weekly, and D, metastatic burden (mean ± SEM of total flux of organs) in the four treatment groups is shown.

References

    1. Bagatell, R. , Beliakoff, J. , David, C.L. , Marron, M.T. , Whitesell, L. , 2005. Hsp90 inhibitors deplete key anti-apoptotic proteins in pediatric solid tumor cells and demonstrate synergistic anticancer activity with cisplatin. Int. J. Cancer. 113, 179–188. - PubMed
    1. Bagatell, R. , Gore, L. , Egorin, M.J. , Ho, R. , Heller, G. , Boucher, N. , Zuhowski, E.G. , Whitlock, J.A. , Hunger, S.P. , Narendran, A. , Katzenstein, H.M. , Arceci, R.J. , Boklan, J. , Herzog, C.E. , Whitesell, L. , Ivy, S.P. , Trippett, T.M. , 2007. Phase I pharmacokinetic and pharmacodynamic study of 17-N-allylamino-17-demethoxygeldanamycin in pediatric patients with recurrent or refractory solid tumors: a pediatric oncology experimental therapeutics investigators consortium study. Clin. Cancer Res.. 13, 1783–1788. - PubMed
    1. Bailly, R.A. , Bosselut, R. , Zucman, J. , Cormier, F. , Delattre, O. , Roussel, M. , Thomas, G. , Ghysdael, J. , 1994. DNA-binding and transcriptional activation properties of the EWS-FLI-1 fusion protein resulting from the t(11;22) translocation in Ewing sarcoma. Mol. Cell. Biol.. 14, 3230–3241. - PMC - PubMed
    1. Benini, S. , Manara, M.C. , Cerisano, V. , Perdichizzi, S. , Strammiello, R. , Serra, M. , Picci, P. , Scotlandi, K. , 2003. Contribution of MEK/MAPK and PI3-K signaling pathway to the malignant behavior of Ewing's sarcoma cells: therapeutic prospects. Int. J. Cancer. 108, 358–366. - PubMed
    1. Blagosklonny, M.V. , Toretsky, J. , Bohen, S. , Neckers, L. , 1996. Mutant conformation of p53 translated in vitro or in vivo requires functional HSP90. Proc. Natl. Acad. Sci.. 93, 8379–8383. - PMC - PubMed

Publication types

MeSH terms